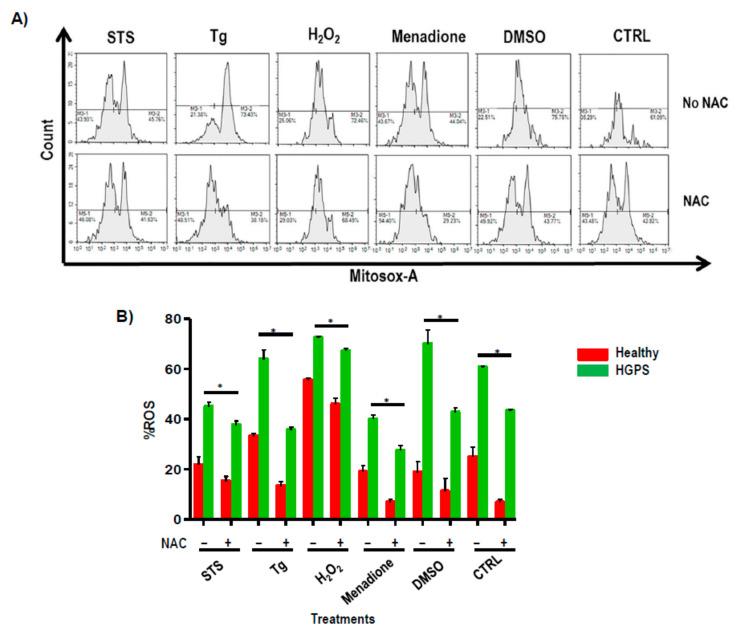
Figure 6.
Reactive oxidative species study. ROS percentage assessed by means of flow cytometry from healthy (AG03257, AG03258, AG03512, and AG06299) and HGPS (AG03198, AG03199, AG03513, and AG06917) human skin fibroblasts treated with or without NAC. (A) Representative FAC histogram of mitochondrial superoxide activity using NovoExpress software (Agilent, CA, USA) from HGPS skin fibroblasts treated with or without NAC. (B) Histograms represent percentages of ROS. Bars are means ± SEM from three independent experiments. * p < 0.05 was considered statistically significant versus healthy cell lines. STS = staurosporine; Tg = thapsigargin; H2O2 = hydrogen peroxide; DMSO = dimethyl sulfoxide.

