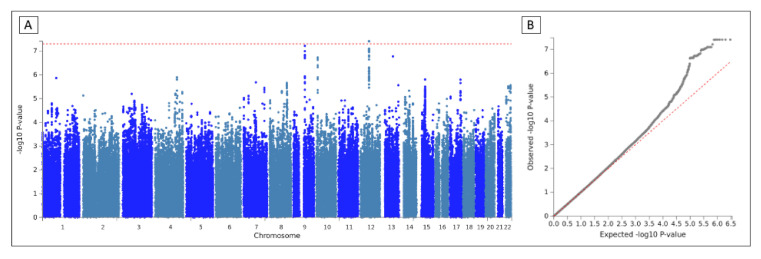
Figure 2.
Manhattan and QQ plot of the meta-analysis. (A) Manhattan plot. SNVs were represented by dots and plotted based on their genome-wide association study p-values. Red line shows genome-wide significance (p-value < 5 × 10⁻⁸). (B) QQ plot of the p-values obtained after the association testing. The x-axis represents the expected −log10—p-value under the null hypothesis and lambda is the median of the resulting chi-squared test statistics divided by the expected median of the chi-squared distribution under the null hypothesis.

