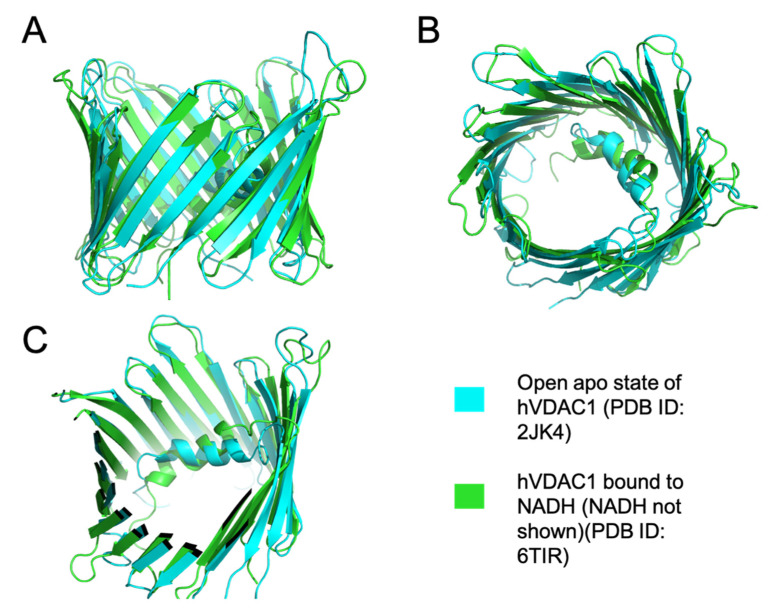
Figure 4.
Superimposition of open apo hVDAC1 and NADH- hVDAC1 structures. (A) Shows the side view of the superimposed structures of the high and low conducting states of hVDAC1 (PDB ID: 6TIR and 2JK4). (B) Shows the top view of the aligned structures. (C) Shows a clipped structure of hVDAC1 to show the N terminal α-helix. The structures were aligned and depicted using Pymol.

