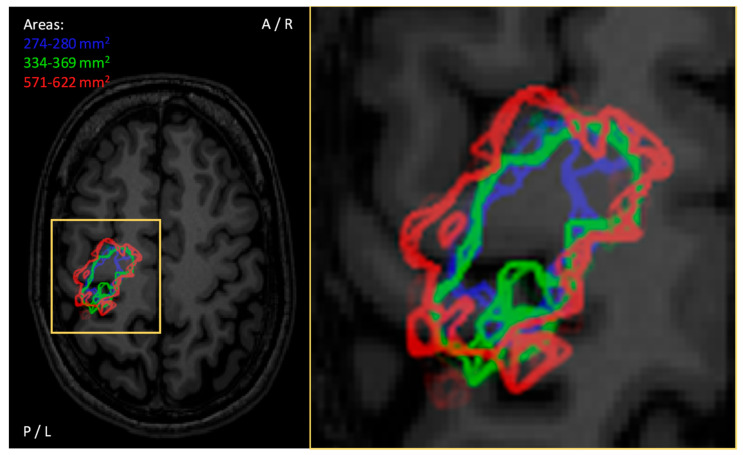
Figure 7.
Visualization of the motor map resulting from mapping with three SIs (blue: 110% of the rMT, green: Mills–Nithi UT method [108], red: 120% rMT). Data from each of the experiments were bootstrapped 1000 times, assuming that 10% of the responses observed were false negative. The image is visualized in neurological projection. The stimulations were placed on average 0.4 mm apart. The 95% confidence limits are indicated for quantified areas in the images.

