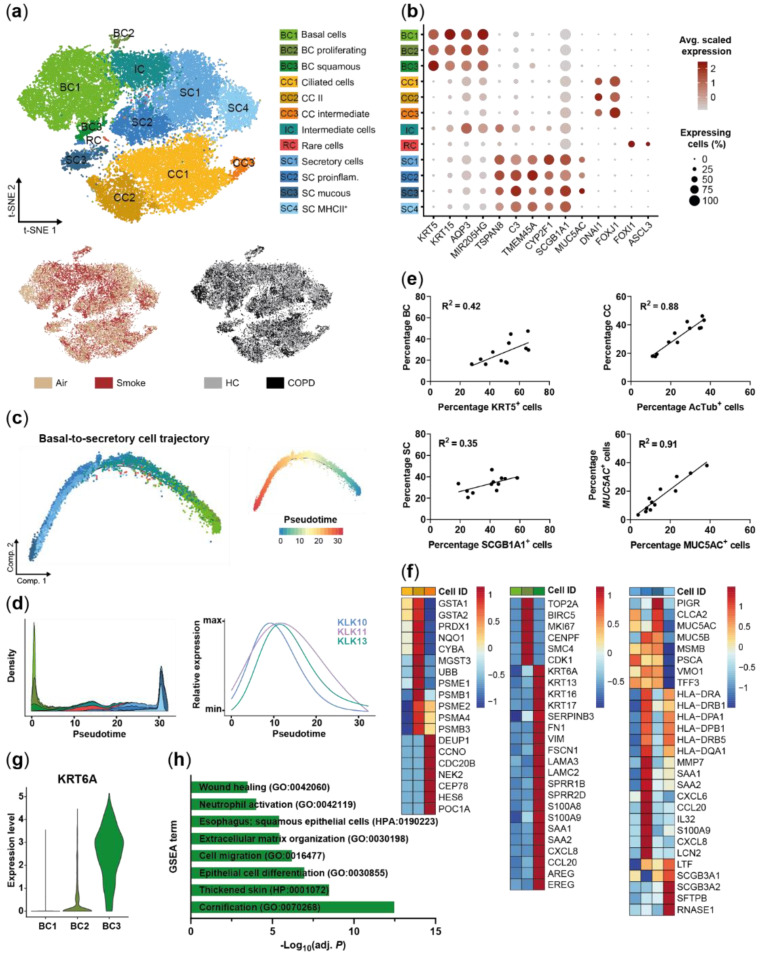
Figure 2.
Characterization of the small airway epithelial cell population. (a) T-SNE plot illustrating the 12 clusters identified in the integrated scRNA-seq data sets of all donors (n = 3 healthy controls (HC) and COPD patients, respectively) including three basal cell (BC) clusters, three ciliated cell (CC) clusters, a basal/secretory intermediate cell (IC) cluster, a rare cell (RC) cluster and four secretory cell (SC) clusters. T-SNE plots in the lower panel illustrate cells by smoking and disease status. (b) Relative expression and fraction of cells that express BC (KRT5, KRT15), CC (FOXJ1, DNAI1), SC (CYP2F1, SCGB1A1) and RC (FOXI1, ASCL3) marker genes across the cell clusters. Low expression levels of typical BC and SC markers are detected in IC, however, IC express a set of genes that are strongly expressed in BC or SC (AQP3, MIR205HG, TSPAN8, C3). (c) Pseudotime analysis of SAEC populations (n = 6, air control and smoke-exposed samples of HC) focused on BC/IC/SC relationship. Trajectories show annotated cell IDs (left) using the color code from (a) and pseudotime values (right) per cell. (d) Left panel represents density (stacked) of the SAEC populations along pseudotime. The right panel depicts the modelled, relative expression of selected kallikrein-related peptidase encoding genes along pseudotime. (e) Correlation of relative cell type frequencies (HC and COPD donors) as determined by scRNA-seq (y-axis) and established protein markers of the respective cell types using flow cytometry (x-axis). (f) Heatmaps depict relative expression levels of selected genes that are significantly differentially expressed (adj. p < 0.05, abs. fold change ≥1.5) across CC, BC and SC subpopulations. (g) Normalized KRT6A expression levels in cells of the three BC subpopulations. (h) Selected molecular processes that are significantly (adj. p < 0.05) associated with BC3 as determined by gene set enrichment analysis (GSEA) of the genes significantly increased compared to BC1 and BC2. AcTub: acetylated-tubulin.

