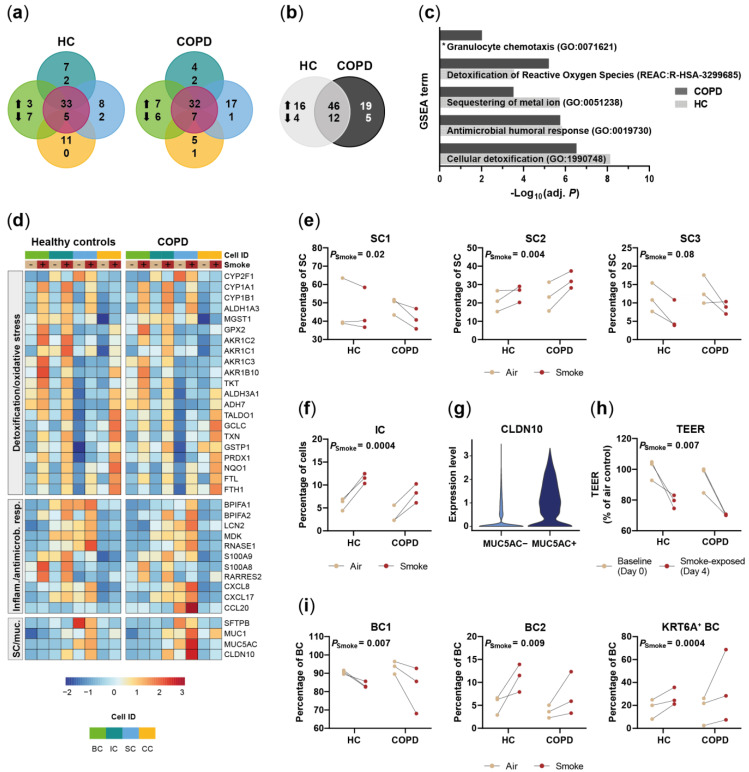
Figure 4.
Acute smoke exposure distinctly alters gene expression and frequency of SAEC populations. (a) Summary of the significantly up- and down-regulated genes (adj. p < 0.05, abs. fold change ≥1.5) by acute smoke exposure across the main SAEC populations (BC, IC, SC and CC according to the color code in (d)) of HC and COPD donors (n = 3, each). Core genes de-regulated in at least two cell types are summarized in the center (violet circle). (b) Comparison of the genes that are significantly de-regulated by acute smoke exposure in at least one of the four main cell populations of HC and COPD donors. (c) GSEA on the up-regulated genes from (b). Significantly (adj. p < 0.05) enriched molecular processes are shown for HC and COPD. (d) Relative expression of genes associated with cellular detoxification/oxidative stress, inflammatory/antimicrobial response and mucus production/secretory cells across the four main SAEC populations. Average gene expression is shown for air control and smoke-exposed cells from both, HC and COPD donors. (e,f,i) Smoke-induced shifts of selected SC and BC subpopulation frequencies and the total IC frequency are depicted in dot plots. Data are linked by donor. (g) Violin plot illustrating CLDN10 expression levels in MUC5AC+ and MUC5AC- SC cells. (h) Shift in transepithelial electrical resistance (TEER) per HC and COPD donor after acute smoke exposure (Day 4) compared to baseline (Day 0). *: pathway not significantly enriched (adj. p > 0.05).

