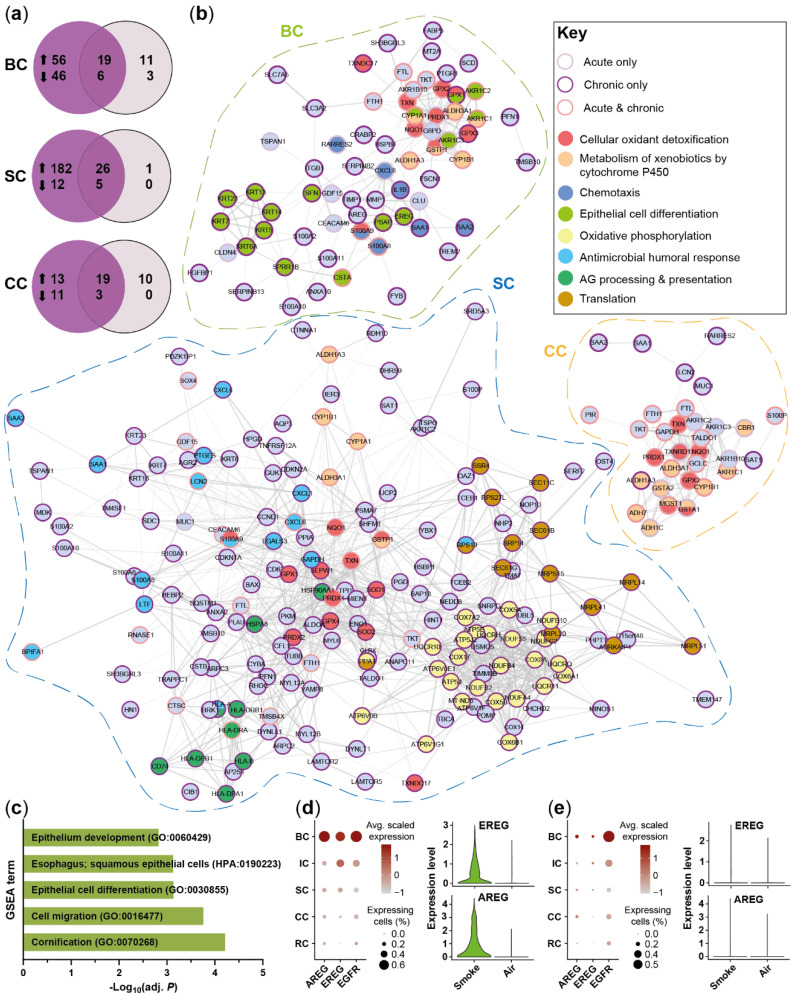
Figure 6.
Differentiation of acute and chronic smoke exposure-induced molecular responses. (a) Comparison of significantly up- and down-regulated (adj. p < 0.05, abs. fold change ≥1.5) genes in BC, SC and CC after acute smoke exposure and smoke exposure throughout differentiation compared to air controls. (b) Functional network analysis based on the genes up-regulated by acute smoke exposure and/or smoke exposure throughout differentiation in BC, SC and CC. Node (gene) borders indicate whether the respective gene is up-regulated by acute or chronic smoke exposure or both. Node colors refer to selected molecular mechanisms that are significantly associated (adj. p < 0.05) with the gene set of the respective cell types. (c) Selected molecular processes identified by GSEA that are significantly (adj. p < 0.05) associated with the gene set up-regulated in BC only after chronic smoke exposure compared to air controls. (d,e) Relative expression of the EGFR-signaling associated genes AREG, EREG and EGFR across SAEC populations after chronic (d) and acute (e) smoke exposure is illustrated by dot plots. Comparison of normalized EREG and AREG expression in basal cells from smoke-exposed and air control ALI cultures is represented by violin plots.

