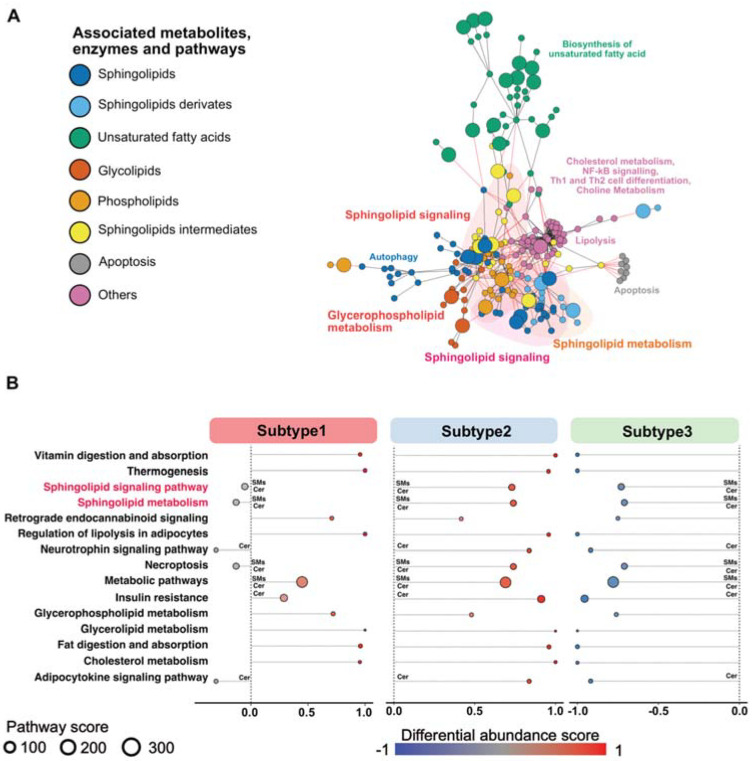
Figure 3.
Differential metabolite abundance of complex lipid and fatty acids in metabolic subtypes: (A) network analysis depicts significantly enriched metabolites and pathways. Different node colors indicate different network clusters or closely interconnected metabolites. Red lines represent interacting nodes. (B) A pathway-based analysis of significant metabolic changes comparing patients assigned to a specific metabolic subtype to the rest of patients. The differential abundance score captures the average gross changes for all metabolites in a pathway. A score of 1 indicates increase in all measured metabolites in the pathway, whereas −1 indicates decrease in all measured metabolites in a pathway. Pathways associated with sphingomyelins and ceramides are marked with SMs/Cer.

