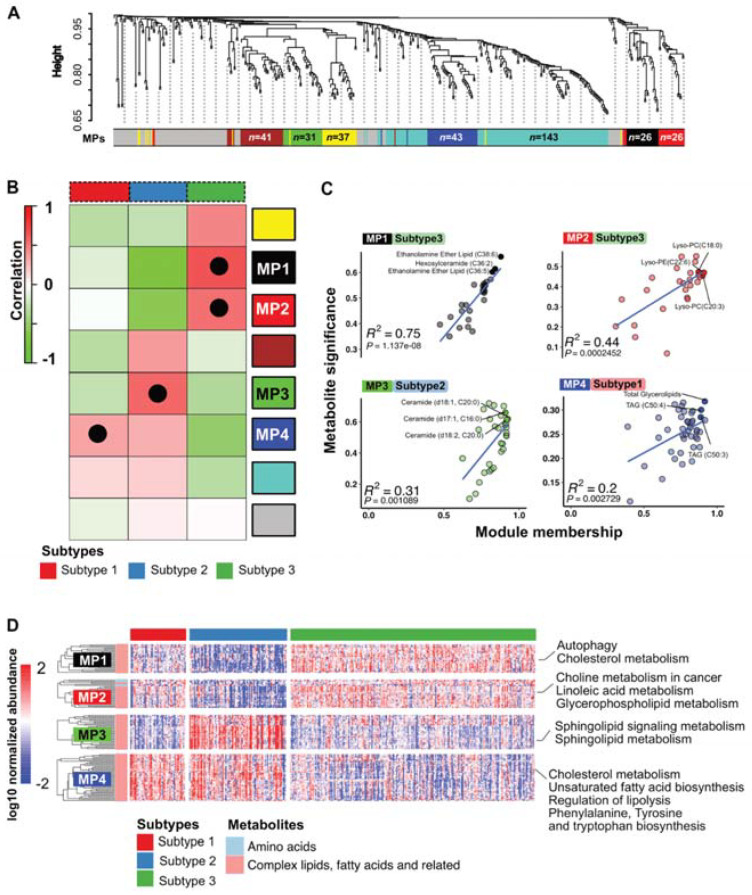
Figure 4.
Core metabolic programs (MPs) define metabolic subtypes: (A) WGCNA cluster dendrogram of differentially expressed metabolites. Each leaf (vertical line) in the dendrogram corresponds to a metabolite. The colored row underneath the dendrogram shows the assigned modules, called metabolic programs (MPs). (B) Heatmap of metabolic programs (MPs) that were correlated to metabolic PDAC subclasses. Black dots denote metabolic networks with highest significance for a PDAC subclass. (C) Scatter plot depicts correlations between enriched metabolic programs (MPs) and metabolic subtype. The three most significant metabolites are named. Pearson correlation coefficient and p-value are presented in the plot. p-value < 0.05 is considered significant. (D) Heatmap represents differential pattern of log10 normalized metabolites abundance in the specified MPs that showed the highest correlation to the metabolic subtypes.

