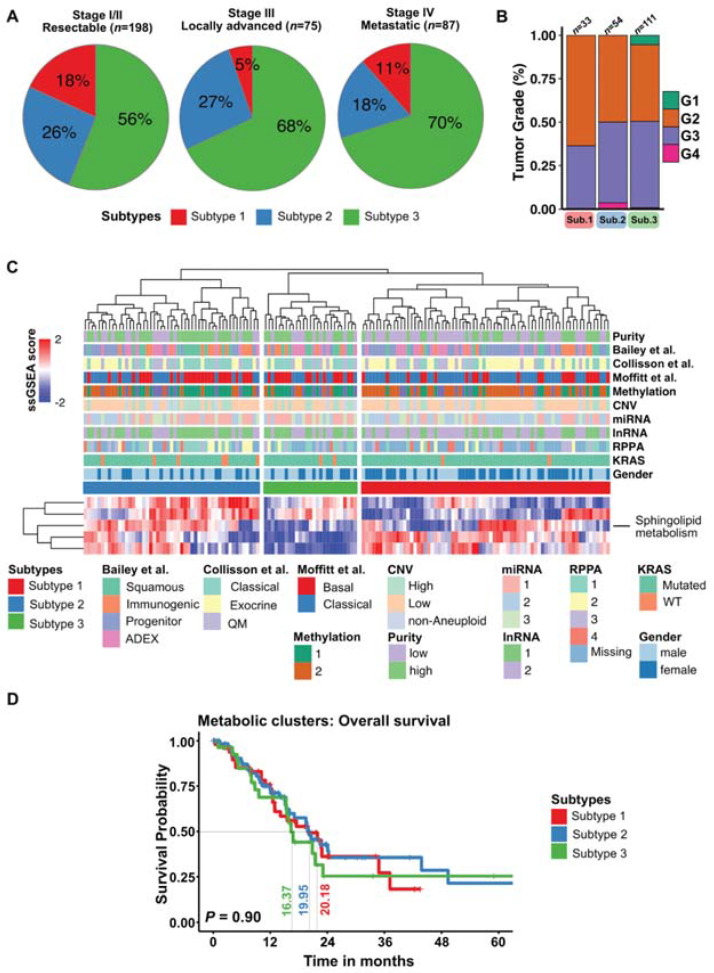
Figure 5.
Correlation between TCGA-PAAD transcriptome and metabolic subtypes: (A) pie charts show proportions of metabolic subtypes in each clinical stage of PDAC. (B) Stacked bar plot of tumor grades for each metabolic subtype. (C) Consensus clustering heatmap was performed on metabolic genes associated with identified pathways in metabolite subtypes from the TCGA-PAAD data set. Clinical characteristics and transcriptomic subtypes associated with TCGA-PAAD were marked with color bars above heatmap. (D) Kaplan–Meier curves of cancer specific overall survival of individual subtypes delineated from TCGA-PAAD dataset. p < 0.05 is considered significant.

