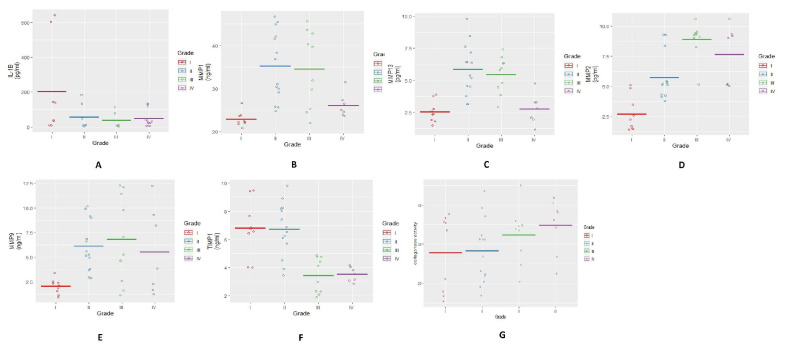
Figure 2.
Estimation of MMP abundance (in protein forms) and activity in OA SFs. (A) a scatter plot depicting grade-wise estimation of IL-1β; the highest value of IL-1β was found in SFs of KL grade-I. A grade-wise decline was seen in the levels; no statistically significant difference was noted in inter-grade comparison. (B) a grade-wise pattern of MMP-1 revealed maximum abundance in SFs from KL grade-II and III; a significant difference in MMP-1 was noted between KL grade-I and II (p < 0.001), KL grade-I and grade-III (p < 0.01) and KL grade-II and grade-IV (p < 0.05). (C) depicts grade-wise estimation of MMP-13; the highest levels were found in SFs from KL grade-II and III; statistically significant difference in MMP-13 was noted between KL grade-I and grade-II (p < 0.001), KL grade-I and III (p < 0.001), KL grade-II and IV (p < 0.001) and KL grade-III and grade-IV (p < 0.01). (D) a grade-wise expression of MMP-2 showed maximum abundance in KL grade-III samples; a marked difference was seen between KL grade-I and II (p < 0.001), KL grade-I and III (p < 0.001), KL grade-I and IV (p < 0.001) and KL grades-II and III (p < 0.001). (E) a grade-wise estimation of MMP-9 revealed the highest level in moderate OA SFs (KL grade-II and grade-III). In inter-grade comparison, a significant difference was noted between KL grade-I and KL grade-II (p < 0.05) and also between KL grade-I and grade-III (p < 0.05). (F) demonstrates a grade-wise estimation of TIMP-1 level; higher levels were seen in early grade samples (KL grade-I and II); in inter-grade comparison, a marked difference was noted between KL grade-I and III (p < 0.001), KL grade-I and IV (p < 0.001), KL grade-II and III and KL grade-II and IV (p < 0.001). (G) shows a grade-wise MMP activity measured using synthetic substrate FALGPA; maximum activity was estimated in SFs from KL grade-II and III, while the lowest activity was found in KL grade-I SFs. No significant difference was noted in inter-grade comparison.

