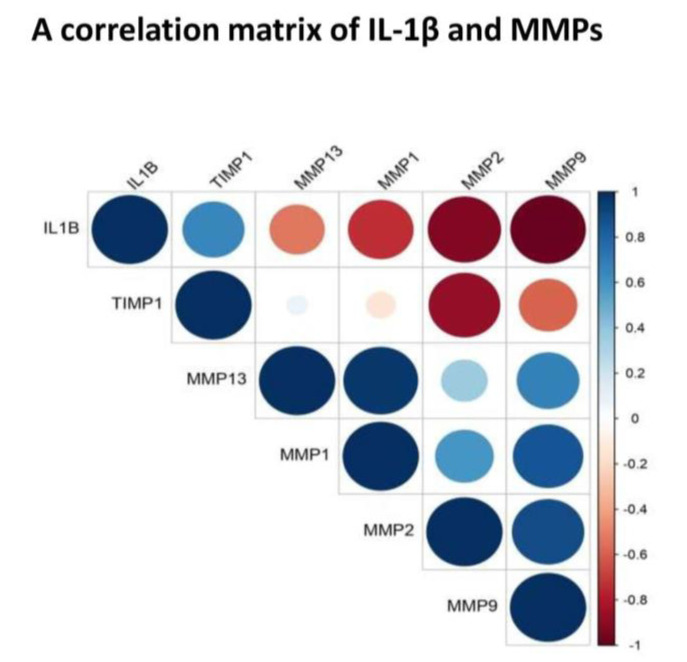
Figure 5.
Correlation matrix of IL-1β, MMP-1, MMP-13, MMP-2, MMP-9 and TIMP−1. The matrix was developed using a cumulative mean value (mean of all grades) estimated from SF for each selected marker. It revealed a negative correlation between—IL-β and MMP-1 (correlation coefficient: −0.74); IL-1β and MMP-2 (correlation coefficient: −0.92); IL-1β and MMP-9 (correlation coefficient: −0.98); IL-1β and MMP-13 (correlation coefficient: −0.52); It showed a strong positive correlation between MMP-1 and MMP-13 (correlation coefficient: 0.96) as well as between MMP-2 and MMP-9 (correlation coefficient: 0.90).

