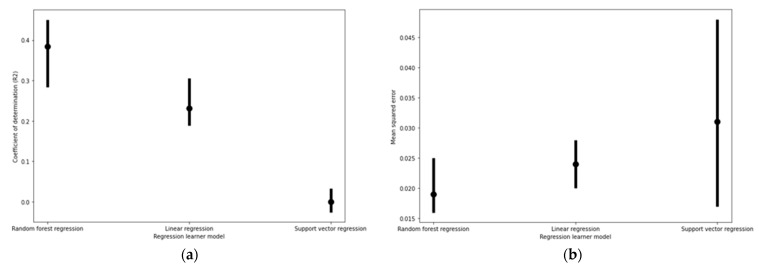
Figure 1.
Cell viability regression model performance based on (a) coefficients of determination (R2) and (b) mean squared error (MSE) values under fivefold cross validation. The upper and lower bounds of the error plots represent the maximum and minimum R2 and mean square error values produced amongst the five testing and training combinations.

