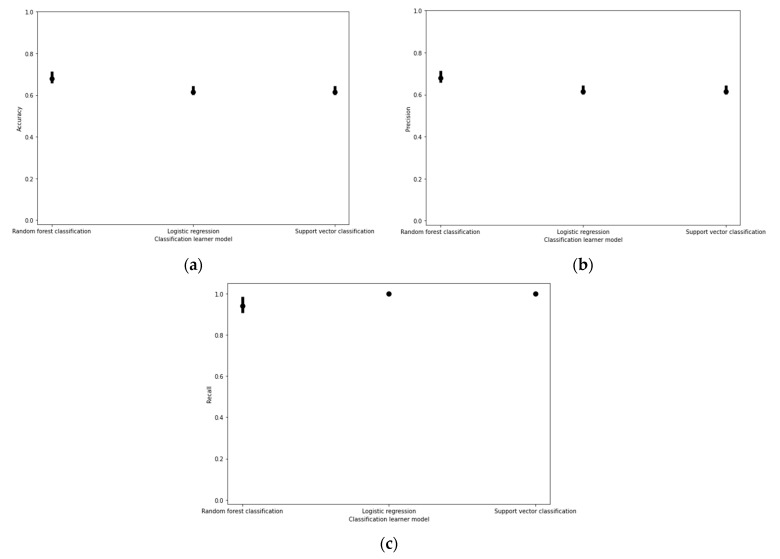
Figure 2.
(a) Cell viability classification model performance based on accuracy, (b) precision, and (c) recall scores under fivefold cross validation. The upper and lower bounds of the error plots represent the maximum and minimum scores produced amongst all five combinations of one fold being trained and tested on the remaining four folds.

