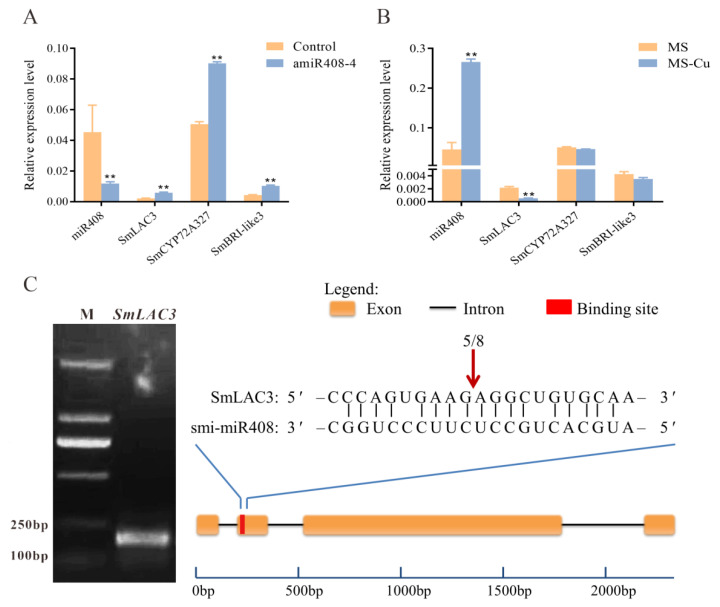
Figure 5.
Validation of Sm-miR408 target genes. (A) Relative expression levels of the Sm-miR408 putative target genes in amiR408 lines compared to control lines. (B) Relative expression levels of the Sm-miR408 putative target genes under normal and copper starvation conditions. (C) Sm-miR408 cleavage site in SmLAC3 mRNA validated by 5’ RLM-RACE. For RT-qPCR, all data represent the means of three biological replicates, with error bars indicating SD. Significant differences were determined by Student’s t-test (** p < 0.01).

