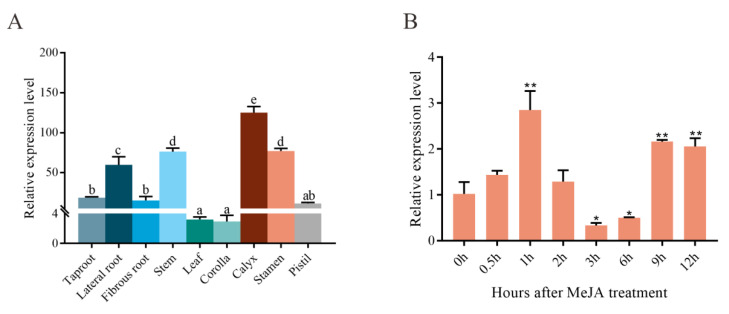
Figure 6.
Expression patterns of SmLAC3. (A) qRT-PCR analysis of SmLAC3 expression in various S. miltiorrhiza tissues. Different lowercase letters indicate significant differences at p < 0.05 by one-way ANOVA with Tukey’s multiple comparisons test. (B) SmLAC3 expression in response to a 100 μM MeJA treatment. All data represent the means of three biological replicates, with error bars indicating SD. Significant differences were determined by Dunnett’s multiple comparison test (** p < 0.01; * p < 0.05).

