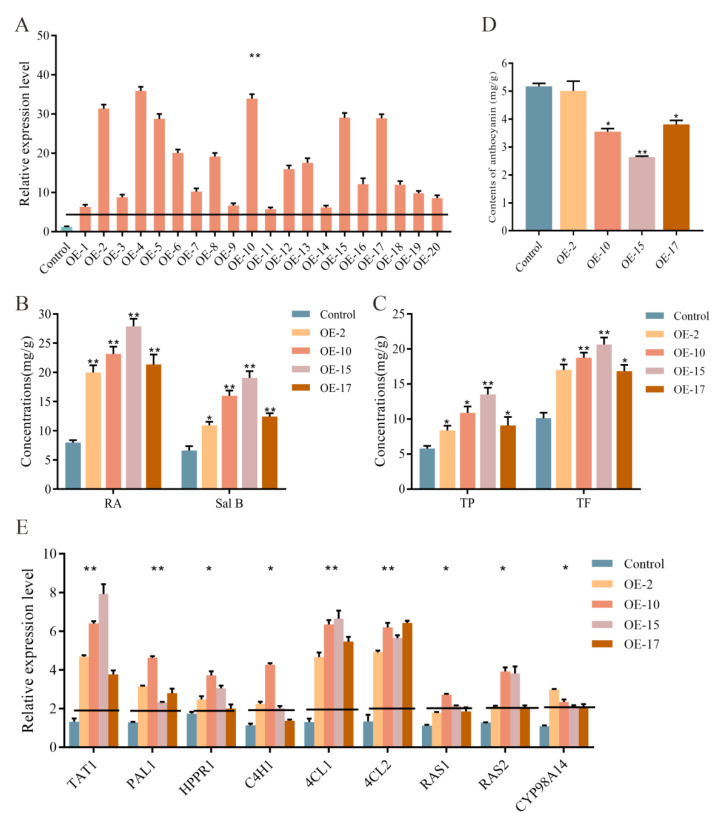
Figure 7.
Effects of overexpressed SmLAC3 on the phenolic acid biosynthesis pathway. (A) qRT-PCR analysis of SmLAC3 expression in transgenic and control lines. (B) Concentrations of RA and SalB in the roots of SmLAC3-OE and control lines. (C) Concentrations of TP and TF in the roots of SmLAC3-OE and control lines. (D) Detection of anthocyanin content in SmLAC3-OE and control lines. (E) Relative expression levels of genes involved in the SmLAC3-OE phenolic acid pathway and control lines. All data are the means of three independent experiments, with error bars representing SD. Significant differences in comparison with the control were determined by Dunnett’s multiple comparison test (** p < 0.01; * p < 0.05).

