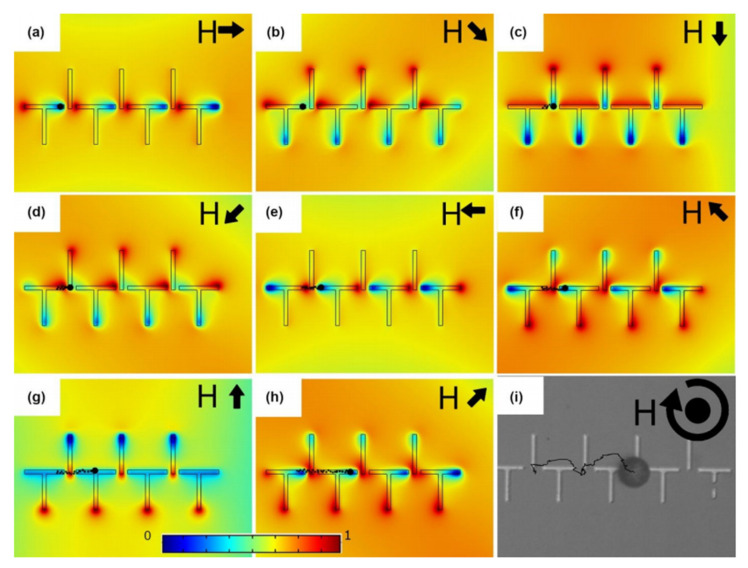
Figure 11.
(a–h) Magnetic energy distribution simulation results for the magnetic thin film pattern exposed to a 3D rotating magnetic field with a cone angle of 45 degrees are shown. The black arrows stand for the in-plane magnetic field direction in each panel. The black circle depicts the particle, the trajectory of which is illustrated by the dotted line. The blue and red areas stand for the energy minimum and maximum, respectively. (i) The experimental trajectory of a magnetic particle transported along the magnetic track is shown with the black line. Reprinted from R. Abedini-Nassab, et al., 2021 Lab on a Chip 21, 1998–2007 [115] with permission from Royal Society of Chemistry.

