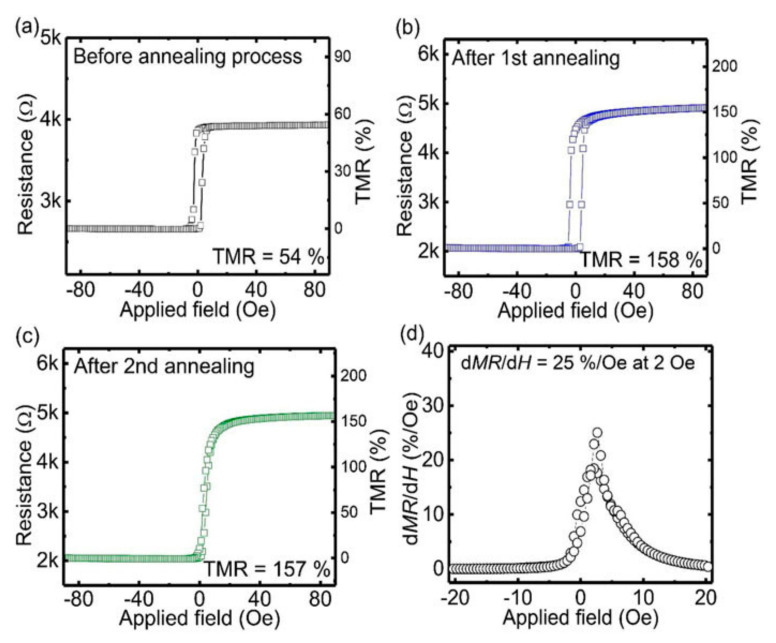
Figure 17.
The transfer curves of the TMR sensor proposed in [141] (a) before the annealing process, (b) after the first annealing, with an applied magnetic field of 10 kOe at 350°C, (c) after the second annealing process, with an applied magnetic field of 10 kOe at 300 °C, and (d) the dMR/dH dependence on the applied magnetic field are plotted. Reprinted with permission from Z. Jin et al., 2021 AIP Advances 11(1) [141], under a Creative Commons Attribution (CC BY) license. Copyright 2021 AIP Publishing.

