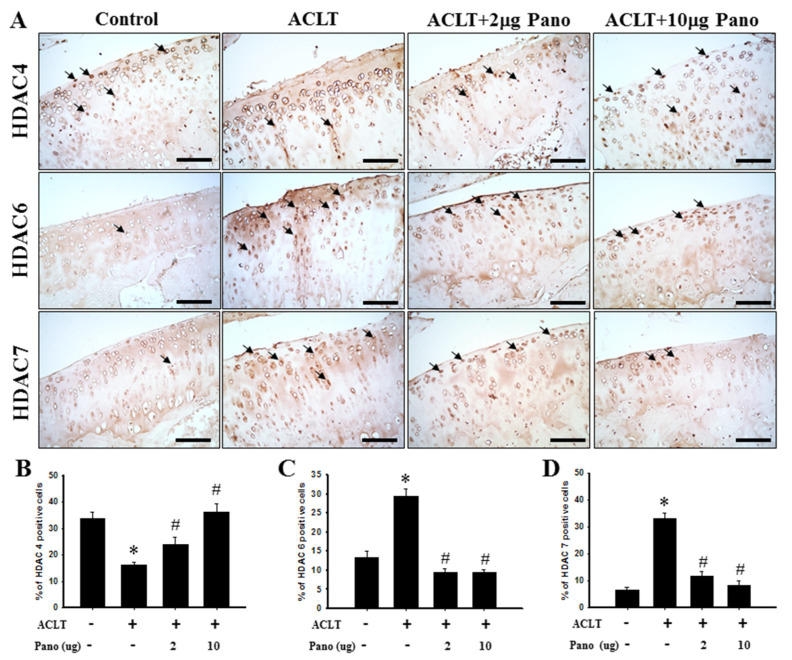
Figure 4.
Effects of panobinostat on the expression of HDAC4, HDAC6, and HDAC7 in cartilage tissues. (A) Immunohistochemical staining of HDAC4, HDAC6, and HDAC7 in joint sections from the control, ACLT, ACLT + panobinostat (2 or 10 μg) groups. The immunoreactive positive cells are indicated in brown (arrows). Results from the quantitative analysis of the ratio of (B) HDAC4-, (C) HDAC6-, and (D) HDAC7-positive cells in joint sections are presented. Data are expressed as means ± SEM for each group. Scale bar represents 100 μm. HDAC, histone deacetylase; ACLT, anterior cruciate ligament transection; Pano, panobinostat; SEM, standard error of the mean. (* p < 0.05 vs. the control group; # p < 0.05 vs. the ACLT group).

