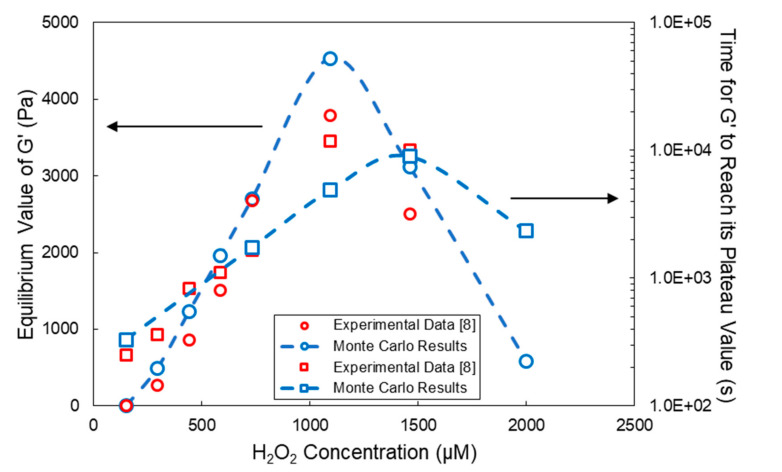
Figure 10.
Effect of the H2O2 concentration on the G′ equilibrium value and time required for G′ to reach its plateau value for the HA-Tyr crosslinkable solution (i.e., 1.75% w/v, MW = 90 kDa and HRP concentration = 0.062 units/mL). Blue squares with a blue dashed line and blue circles with a blue dashed line represent the MC calculated values, and red circles and squares denote the respective experimental measurements of Lee et al. [8]. All MC simulations were conducted with an initial polymer chain population of ~106.

