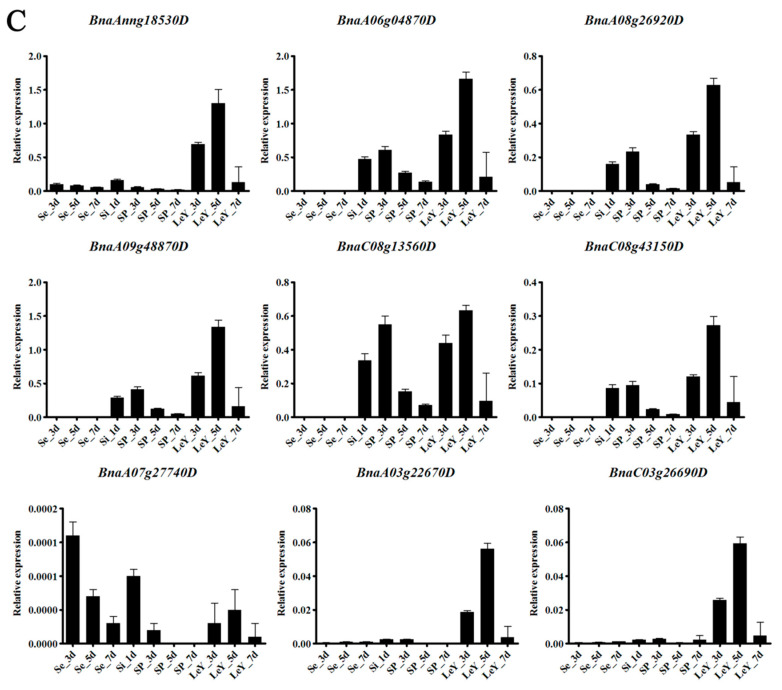
Figure 7.
Relative expression of nine BnaYAB genes in different tissues and growth stages of B. napus. Relative expression levels in different tissues at the initial flowering stage (A), at the full flowering stage (B), and during the green pod stage (C). The abbreviations along the x-axes represent the different samples (Table S6). A red box indicates that the gene is only highly expressed in one tissue.


