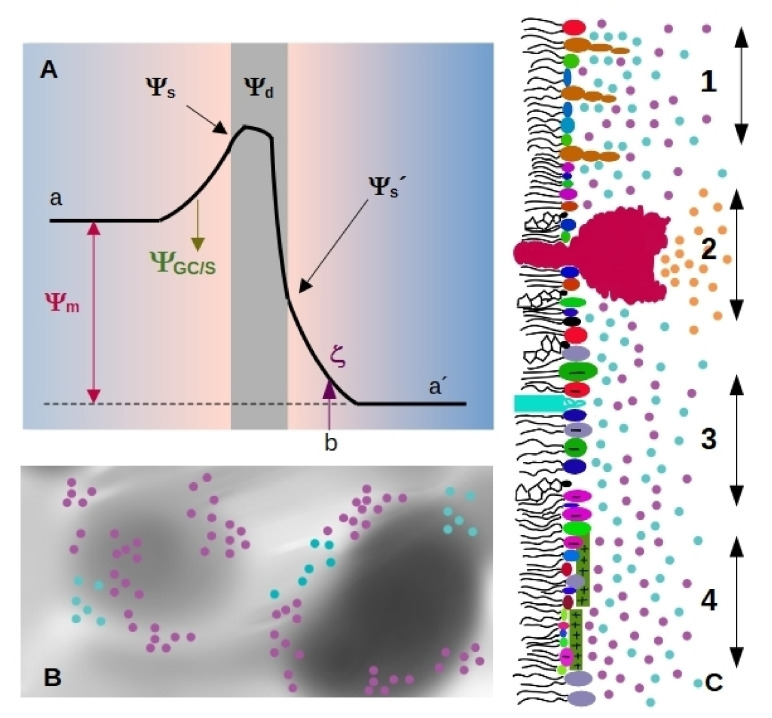
Figure 1.
Scheme illustrating membrane electrostatics. (A) Electrostatic potential profiles that bear a membrane (gray region) along the normal axis. Volta potentials are usually different on each side of the membrane, the difference between the value on the left (a) and right (a’) side corresponds to the membrane potential . Charged species on the membrane generate the surface potential . The charged membrane induce an ion cloud and a potential drop characterized through Gouy-Chapman or Stern model . In the scheme, the slipping plane is at a distance b from the membrane, and the potential value at this point corresponds to the zeta potential . Membranes are composed of multipoles organized in an ordered array, generating the dipole potential . (B) Possible charge distribution in the membrane plane with non-homogeneous electrical properties. Gray levels indicate different values for the dielectric constant. Cyan circles represent cations and pink circles, anions. (C) Lateral view of a membrane hemilayer, where different situations coexist. As in B, cyan circles represent cations and pink circles, anions. 1—Gangliosides protrude from the plane formed by the polar head groups of less bulky lipids, generating a rough surface. 2—A pump or a channel generates a local ion gradient (orange circles correspond to protons, sodium, calcium or the specific ion that passes trough the pump/channel). 3—Region of the membrane enriched in anionic lipids. This region will attract cations. 4—cationic peptides adsorbed to a region of the membrane generate a positive surface that attracts anions.

