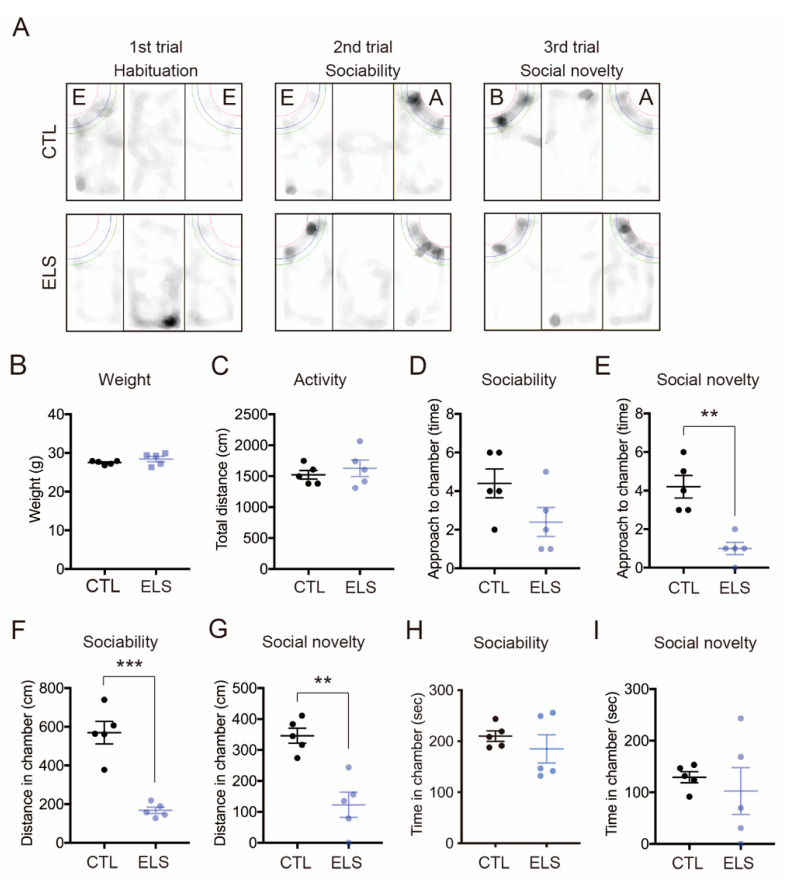
Figure 3.
ELS distinctively affected social behaviors in mice. (A) Mount graph showing behavioral trace examples in the three-chamber social interaction test. E, empty; A: stranger mouse 1; B: stranger mouse 2. (B–I) Reduced social behavior was observed in ELS mice. There was no difference in weight (B) or total distance (C) in the three-chamber social interaction test. (D–I) The number of approaches (D), time (F), and distance (H) is shown during the 2nd trial (sociability behavior) (D,F,H) and the 3rd trial (social novelty behavior) (E,G,I), respectively. CTL, control mice; ELS, early life stressed mice. Data are represented as the means (±SEM). Asterisks indicate *** p < 0.001, ** p < 0.01, unpaired t-test, n = 5/condition.

