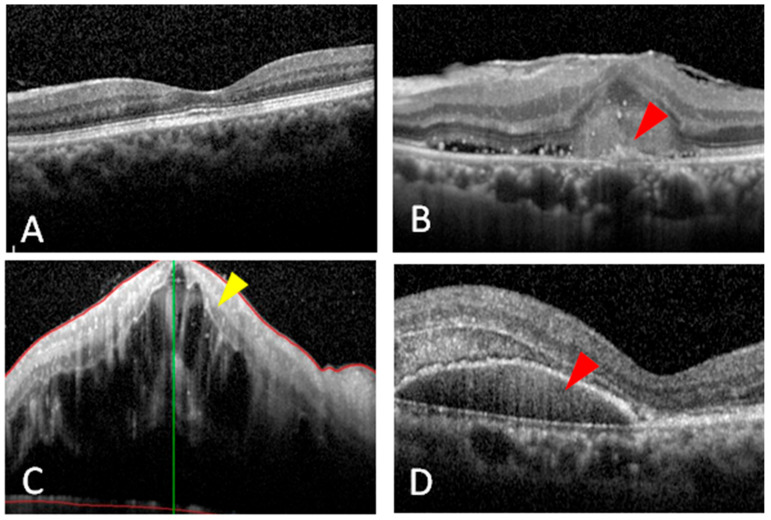
Figure 2.
Optical coherence tomography images of the patients with different retinal diseases. (A) The image showed a normal macula in the patient with senile cataracts (as the control group). Red arrowheads indicate pigment epithelium detachments and drusen formation in a patient with (B) wet age-related macular degeneration and (D) polypoidal choroidal vasculopathy. (C) The yellow arrowhead shows massive macular edema in a patient with central retinal vein occlusion.

