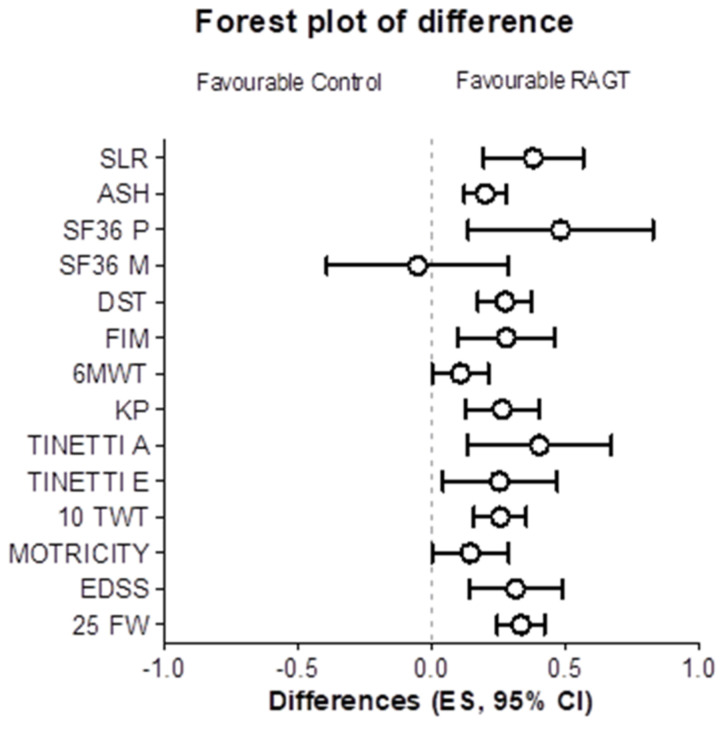
Figure 2.
Forest plot of the treatment differences. The effect sizes (ES) were calculated as changes from pre-training for each intervention and then the ES differences between robot assisted gait training (RAGT) and control intervention were computed to create the forest plot. The quantitative report of the ES difference is reported Table 2.

