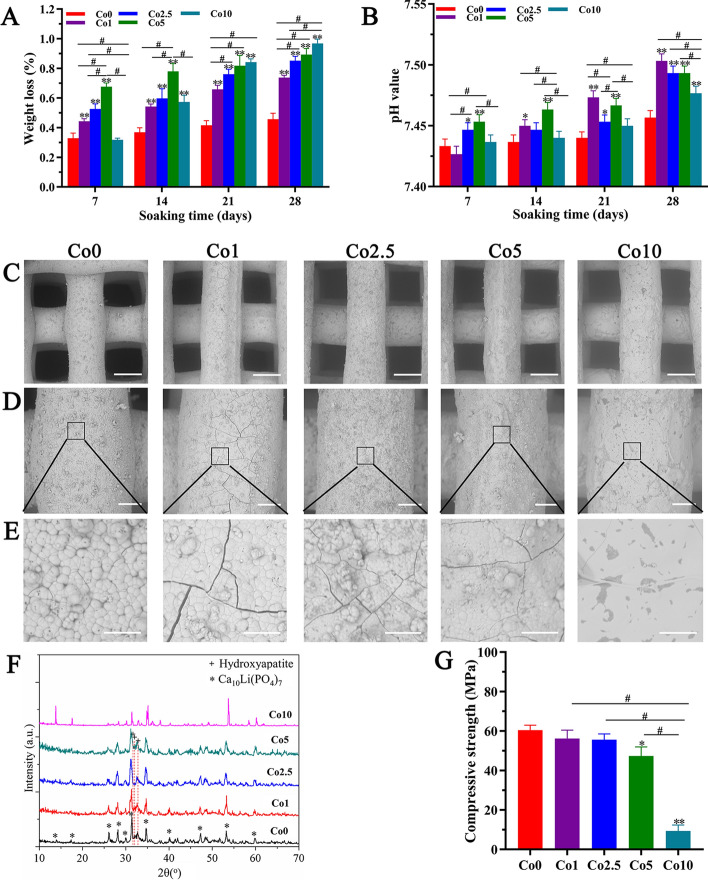
Fig. 4.
In vitro physicochemical properties of the Co (0, 1, 2.5, 5, 10) scaffolds. A Weight loss of the Co (0, 1, 2.5, 5, 10) scaffolds. B pH value of Tris–HCl solution after soaking the Co (0, 1, 2.5, 5, 10) scaffolds. C–E SEM images of the surface microstructure of the Co (0, 1, 2.5, 5, 10) scaffolds after mineralization in vitro (scale bars: Figure C = 300 µm, Figure D = 100 µm, Figure E = 20 µm). F XRD patterns of the Co (0, 1, 2.5, 5, 10) scaffolds after mineralization in vitro. G Compressive strength of the Co (0, 1, 2.5, 5, 10) scaffolds. The data are expressed as the mean ± SD. *p < 0.05 and **p < 0.01, comparison with the Co0 group; #p < 0.05, comparison among the Co (1, 2.5, 5, 10) groups

