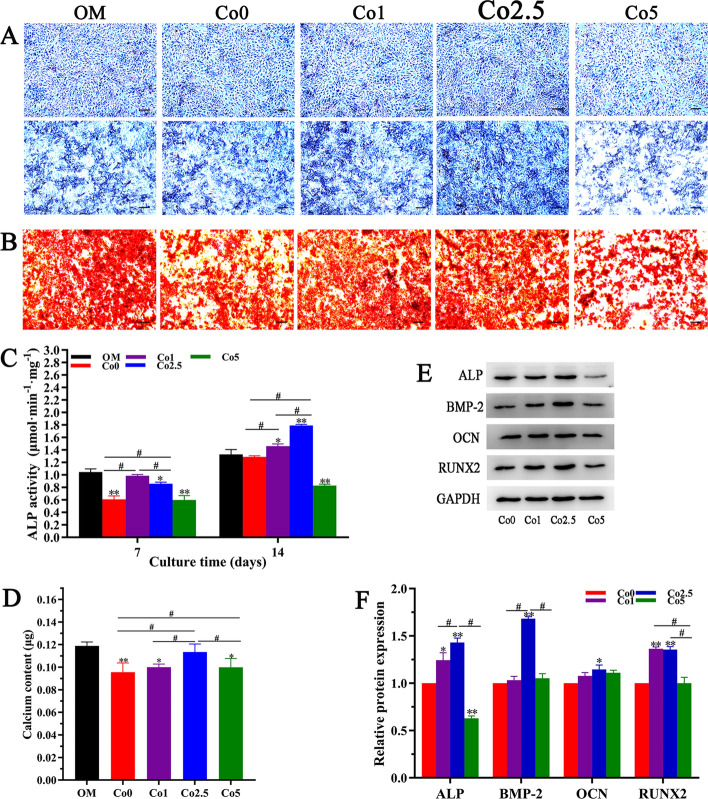
Fig. 7.
In vitro osteogenic properties of the Co (0, 1, 2.5, 5) scaffolds. A Micrographs of ALP staining at days 7 and 14 and B alizarin red staining at day 21 are shown (scale bars = 100 µm). The quantitative analysis of ALP activity (C) and calcium content (D) are shown. The group in which rBMSCs were cultured in osteogenic medium (OM) was set as the positive control group. The data are expressed as the mean ± SD. *p < 0.05 and **p < 0.01, comparison with the OM group; #p < 0.05, comparison among the Co (0, 1, 2.5, 5) groups. E Western blot analysis of osteogenic markers (ALP, BMP-2, OCN and RUNX2) and their quantitative analysis (F) in rBMSCs stimulated by the Co (0, 1, 2.5, 5) extracts for 14 days. The data are expressed as the mean ± SD. *p < 0.05 and **p < 0.01, comparison with the Co0 group; #p < 0.05, comparison among the Co (1, 2.5, 5) groups

