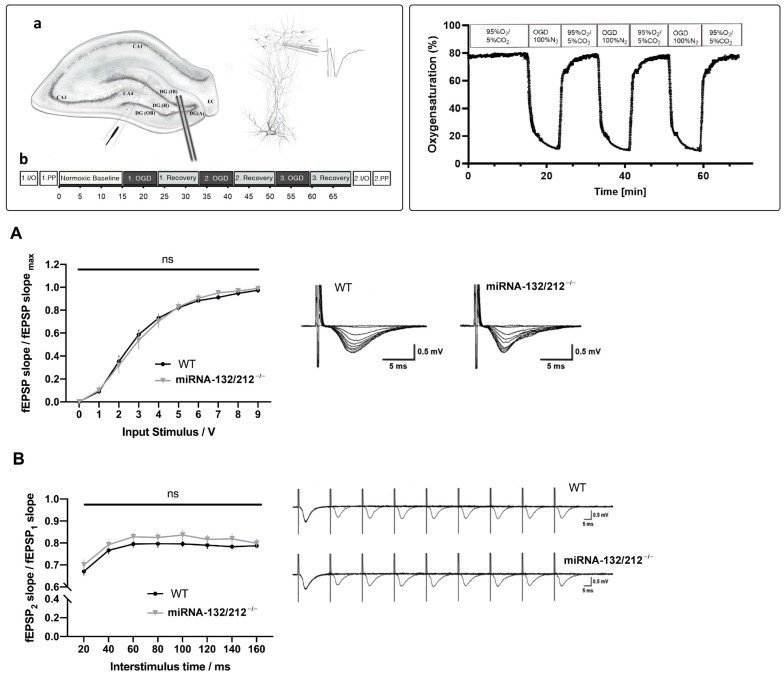
Figure 1.
miRNA-132/212 deletion did not alter basal synaptic transmission and paired-pulse inhibition (PPI) in the hippocampal dentate gyrus. Inset (1) Schematic representation of the electrophysiological recording setting. (a) Diagram of a hippocampal slice, with a schematic representation of the histological layering of the dentate gyrus (middle inset). The lower left inset depicts the positioning of the stimulating and recording electrode. The right inset illustrates the positioning of the recording electrode in relationship to the dendritic layer of the neuronal granule cells and a representation of a recorded field excitatory postsynaptic potential (fEPSP). Arrows denote the flow of inputs from the perforant pathway. (b) Schematic synthesis of the experimental protocol for electrophysiological recordings. CA 1–4: Cornu Ammonis areas 1–4, DG: Dentate gyrus, (A): Apex, (H): Hilus, (IB): Inner Blade, (OB): Outer Blade, EC: Entorhinal cortex, fEPSP: field excitatory postsynaptic potential, I/O: Input Output, PP: Paired pulse stimulation, OGD: Oxygen Glucose Deprivation. Inset (2) Temporal course of the oxygen saturation measured in the recording chamber during repeated episodes of OGD. Superfusion of the recording chamber with 100% N2 gassed OGD aCSF led to a sharp drop of oxygen saturation below 20% within 3 min bottoming at less than 12% oxygen saturation at the end of the OGD period. Reperfusion with carbogenated aCSF (95%O2/5%CO2) increased the oxygen saturation back to values greater than 60% oxygen saturation in less than 1 min. Graph derived from optode recorded oxygen saturation data of three independent recording days. aCSF: artificial cerebrospinal fluid, OGD: Oxygen Glucose Deprivation. (A) I/O curves generated by plotting normalized fEPSP slope changes versus increasing pulses of input stimulation voltages obtained in WT (n = 7) and miRNA-132/212−/−mice (n = 6) hippocampal slices. Two-way repeated measures ANOVA did not reveal statistically significant differences between genotypes before the implementation of the OGD treatment. Right inset: Representative raw fEPSP traces recorded from hippocampal slices obtained from WT mice (left) and miRNA-132/212−/−mice (right) in response to increasing stimulus intensities show no apparent differences. (B) PPI ratios (second pulse/first pulse) plotted against inter-pulse intervals from 20 to 160 ms. No statistically significant differences (“ns” in the figure) between genotypes were detected by two-way repeated measures ANOVA. Right inset: Depiction of representative raw fEPSP traces obtained during the PPI protocol described in the materials and methods section in the dentate gyrus of WT (upper trace) and miRNA-132/212−/− mice (lower trace), without macroscopic differences. Data is presented as mean ± SEM. fEPSP: field excitatory postsynaptic potential, I/O: Input Output, OGD: Oxygen Glucose Deprivation, PPI: Paired Pulse Inhibition.

