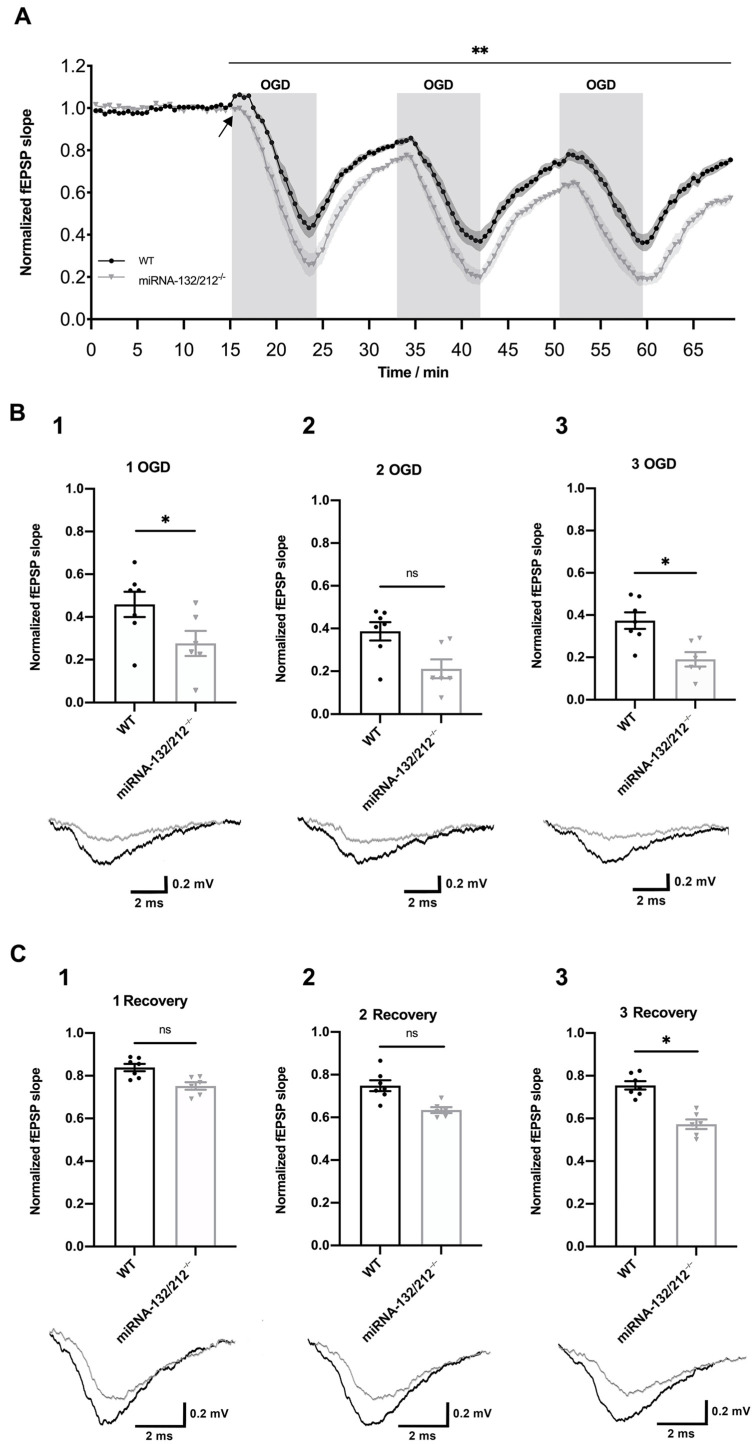
Figure 2.
miRNA-132/212 gene disruption aggravated oxygen glucose deprivation (OGD) induced depression of synaptic transmission in the hippocampal dentate gyrus. (A) Temporal course of the fEPSPs slope changes elicited by three repeated 8 min long OGD episodes (100%N2, Glucose deprived aCSF), with interspersed 10 min recovery intervals (95%O2/5%CO2, 25 mM D-glucose aCSF), in slices obtained from WT (black) (n = 7) and miRNA-132/212−/−mice (gray) (n = 6). fEPSP slope values were normalized to the last 5 min of the initial baseline, under normoxic conditions. fEPSP slopes depressed and recovered to significantly lower values in slices obtained from miRNA-132/212−/−mice, as revealed by two-way repeated measures ANOVA. The black arrow denotes an initial potentiation upon the first OGD episode observed in WT slice recordings, which was virtually absent in recordings from miRNA 132/212−/− slices. (B) Scatter plots depicting normalized fEPSP slopes recorded at the end of the first (B1), second (B2) and third (B3) OGD episodes. Bonferroni post hoc analysis revealed statistically significant genotype differences at the first and third but not second OGD interval. The insets below the scatter plots show representative fEPSP traces obtained from WT (black) and miRNA-132/212−/−mice (grey) at the corresponding time points. (C) Scatter plots depicting normalized fEPSP slopes recorded at the end of the first (C1), second (C2) and third (C3) recovery interval. Bonferroni post hoc analysis revealed statistically significant genotype differences at the end of the last, but not the preceding recovery intervals. The insets below the scatter plots depict representative fEPSP traces obtained from WT (black) and miRNA-132/212−/−mice (grey) at the corresponding time points. Data is presented as mean ± SEM. fEPSP: field excitatory postsynaptic potential, OGD: Oxygen Glucose Deprivation, ns: no statistical significance. p < 0.05 was considered significant. * p < 0.05, ** p < 0.01.

