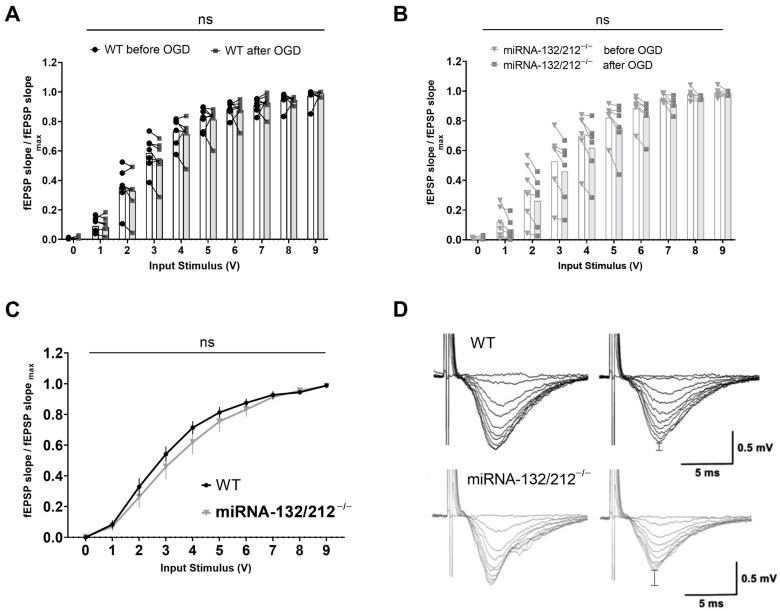
Figure 5.
Repeated OGD did not significantly alter basal synaptic transmission in either genotype. I/O curves generated by plotting normalized fEPSP slope changes versus increasing pulses of input stimulation voltages obtained in WT (n = 7) and miRNA-132/212−/− mice (n = 6) hippocampal slices. Separate two-way ANOVAs with repeated measures comparing basal synaptic transmission recorded before and after OGD treatment in WT dentate gyri (A) and miRNA-132/212−/− dentate gyri (B) did not reveal statistically significant differences. (C) Normalized fEPSP slopes obtained from WT and miRNA-132/212−/− slices after OGD treatment did not differ significantly. (D) Representative raw fEPSP traces recorded from hippocampal slices obtained from WT mice (upper row) and miRNA-132/212−/− mice (lower row) in response to ascending stimulus intensities before (left) and after (right) OGD treatment. In both cases, the differences in the peak amplitudes before and after OGD are emphasized in the right panels by vertical bar indicators. Data is presented as mean ± SEM. fEPSP: field excitatory postsynaptic potential, OGD: Oxygen Glucose Deprivation. ns: no statistical significance.

