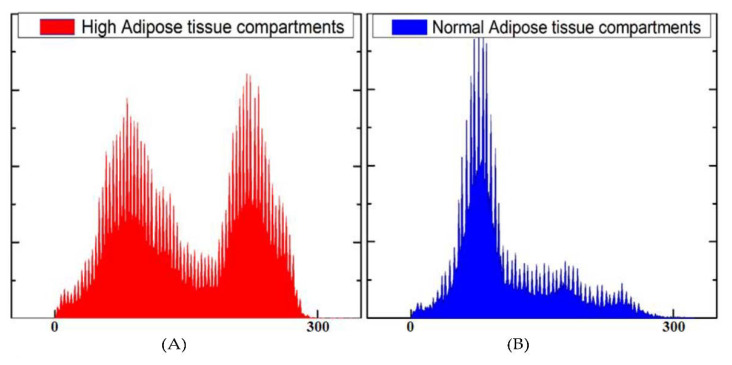
Figure 2.
Histograms of pixel intensities showed two peaks of gray values to differentiate adipose tissue. (A) Representative signal histograms obtained from T1-weighted abdominal MR images with high overall adipose tissue compartments. (B) Representative signal histograms were obtained from T1-weighted abdominal MR images with typical amounts of adipose tissue compartments.

