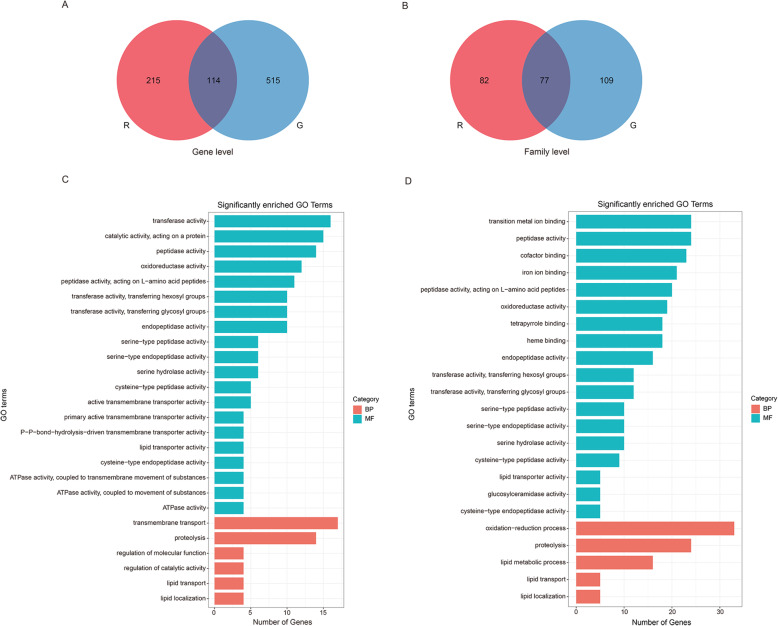
Fig. 4.
Venn-diagram showing the overlaps of DEG sets (|log2 fold change| > 1 and q-value < 0.05) between all the red and green T. urticae populations feeding on different transferred hosts, and GO enrichment of form-specific genes in the red or green T. urticae fed on the three transferred hosts. (A) and (B) are Venn diagram comparisons of combined DEGs derived from the three red and three green T. urticae populations fed on three hosts at gene (A) and family (B) levels. (C) and (D) indicate significant GO enrichment of form-specific DEGs from top10 GO terms with the smallest q value in each of three categories (CC, MF and BP) in the red and green T. urticae, respectively. The X axis represents the number of genes in each GO term, and the Y axis represents significantly enriched GO terms

