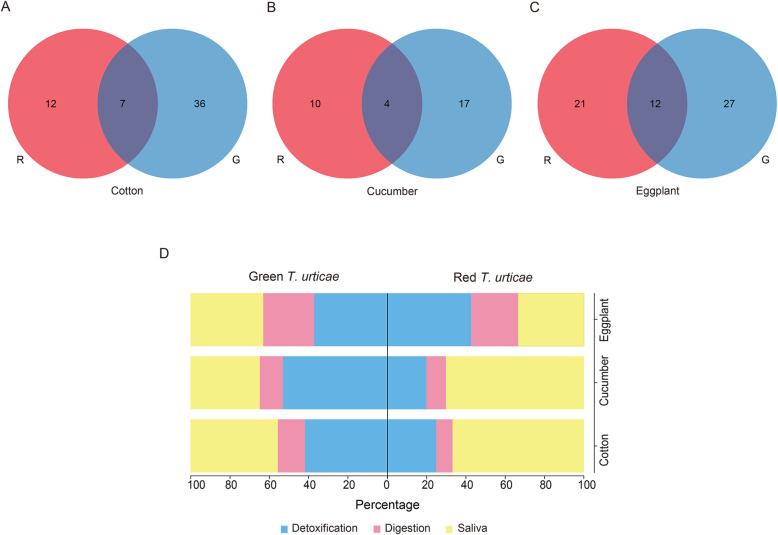
Fig. 8.
Venn diagrams and form-specific DEGs associated with saliva, digestion and detoxification between the red and green T. urticae feeding on the same transferred host. The DEGs of the red or green T. urticae on each of three transferred hosts were derived from overlaps of their three populations: (A) cotton, (B) cucumber and (C) eggplant. The red T. urticae is indicated in red and the other color represents the green T. urticae. (D) indicates different proportions of form-specific DEGs in these families for the red or green T. urticae on each of the three transfers

