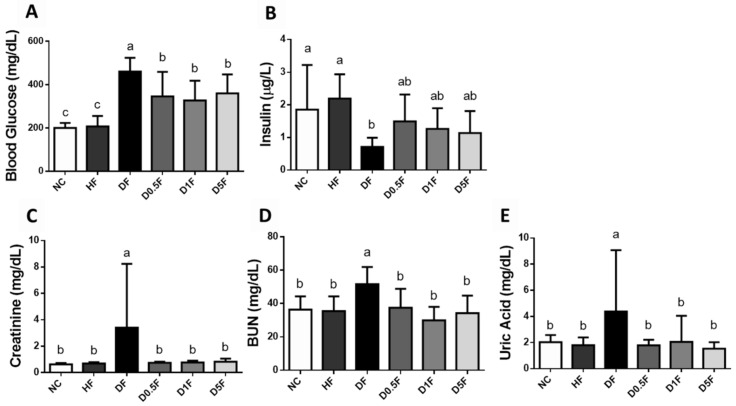
Figure 2.
The changes in blood glucose (A), insulin (B), creatinine (C), BUN (D), and uric acid (E) in diabetic rats fed with different experiment diets for 4 weeks. Results are expressed as mean ± S.D. for each group (n = 7~8). Values with different superscript letters (a, b, c) in columns are significantly different (p < 0.05) from one-way ANOVA followed by Duncan’s multiple range test. NC: Normal control diet. HF: High-fat (HF) diet. DF: STZ diabetes + HF diet. D0.5F: STZ diabetes + HF diet + 0.5% chitosan oligosaccharide (COS). D1F: STZ diabetes + HF diet + 1% COS. D5F: STZ diabetes + HF diet + 5% COS.

