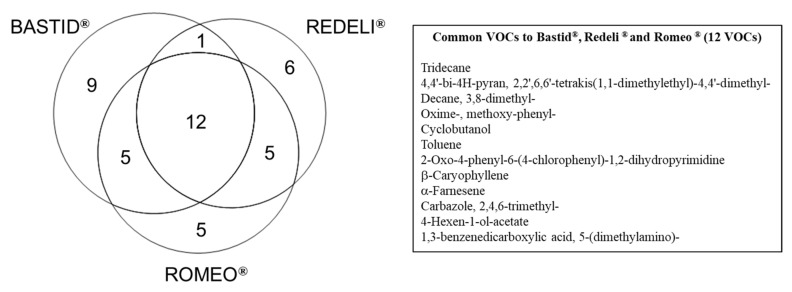
Figure 3.
Venn diagram of the VOCs induced by commercial elicitors. Distribution of 43 VOCs detected with FC > 1.5 at least once at two time points or at least in two replicates for one time point (Table 2), following Bastid®, Redeli® or Romeo® treatment. The 12 commonly induced VOCs are listed in the table on the right.

