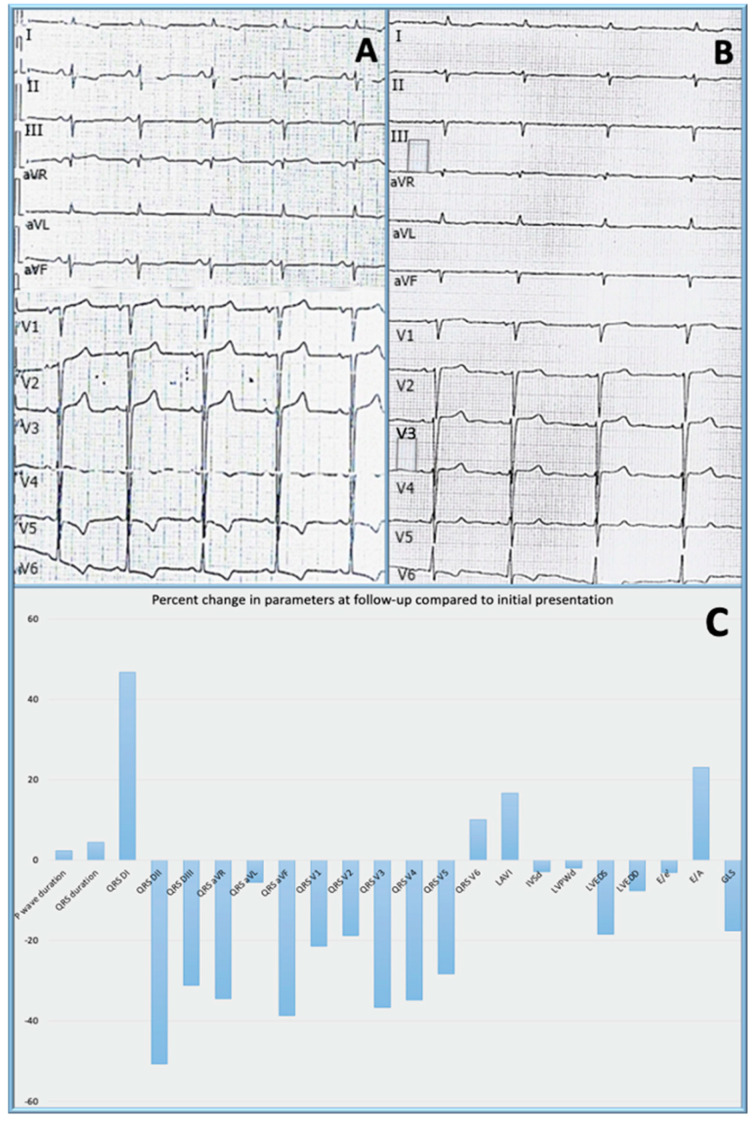
Figure 1.
Electrocardiogram at baseline (A) and at follow-up (B) and percent changes in electrocardiographic and echocardiographic parameters at 9 months follow-up compared to the initial presentation; QRS DI − QRS V6 = QRS voltage in all 12 leads of the standard electrocardiogram; LAVI = left atrial volume index; IVSd = interventricular septum in diastole; LVPWd = left ventricular posterior wall in diastole; LVEDS = left ventricular end-diastolic diameter in systole; LVEDD = left ventricular end-diastolic diameter in diastole; E/e′ = mitral E/e′ ratio; E/A = mitral ratio between the maximal velocity of transmitral flow in early to late diastole; GLS = global longitudinal strain, presented as change in absolute value (C); QRS voltage measured as average of three consecutive beats, using digital calipers at 300% magnification calibrated for paper speed of 25 mm/s.

