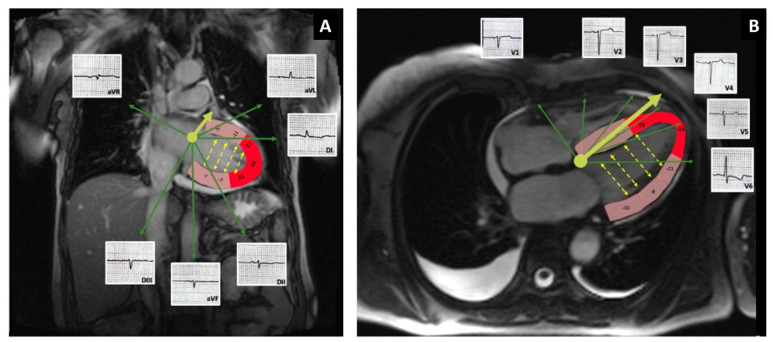
Figure 4.
Potential mechanism responsible for the discordance in voltage between frontal (A) and precordial leads (B). Fused cMRI-GLS images with examples of ECG waves on leads V1–V6. Segments of the LV are color-coded based on local strain values: red corresponds to local strain ≤−16%; pink local strain >−16%. The solid yellow arrow represents the QRS axis. The dotted yellow arrows represent direction of cancellation of electrical forces between opposing walls. The relative apical sparing pattern could be related to the high voltage seen in the precordial leads.

