Figure 4.
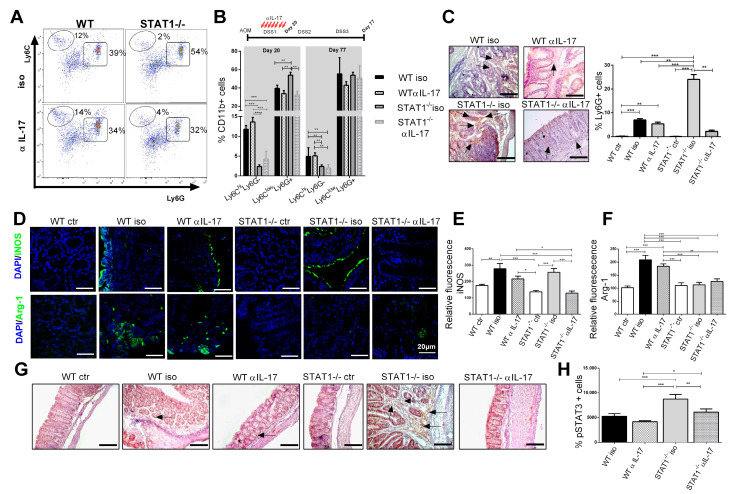
Anti-IL-17 treatment affects the recruitment of neutrophils and CD11b+Ly6ClowLy6G+ cell populations in STAT1-/- mice. Mice were treated as in Figure 3A. Circulating cells were obtained from tumor-bearing WT or STAT1-/- mice treated with anti-IL-17(αIL-17) or isotype (iso) antibodies. (A) representative flow cytometry plots are shown with Ly6C and Ly6G markers of gated living CD11b+ population cells in blood; (B) the bar graph illustrates the frequencies of CD11b+Ly6ChiLy6G-and CD11b+Ly6ClowLy6G+ cell populations in blood at the indicated time intervals (day 20 and day 77), gated as in Figure 4A; (C) representative immunohistochemical staining of Ly6G in colon tissue at day 77. The arrowheads indicate Ly6G localization. Scale bars: 50 µm; (D) confocal representatives merged images of the immunofluorescence staining of the distal/affected colon tissue at day 77 using an anti-iNOS antibody (green) or anti-Arginase-1 antibody (green) and DAPI (blue) counterstaining. The images were captured in a confocal microscope at 63X. Scale bars = 20 μm. Relative fluorescence for iNOS (E) and Arginase-1 (F); (G) representative immunohistochemical staining of phosphorylated STAT3 in colon tissue at day 77. The arrowheads indicate pSTAT3 localization. Scale bars: 100 µm; (H) percentage of cells stained positive for pSTAT3. The quantification of Ly6G+ cells and pSTAT3+ cells was performed using ImageJ software v.1.48 by counting cells in 10 high-powered fields from at least three slides per animal. Data shown are the mean ± SEM of at least four or five mice per group and are representative of two individual experiments with similar results. * p < 0.05, ** p < 0.01, *** p < 0.001.

