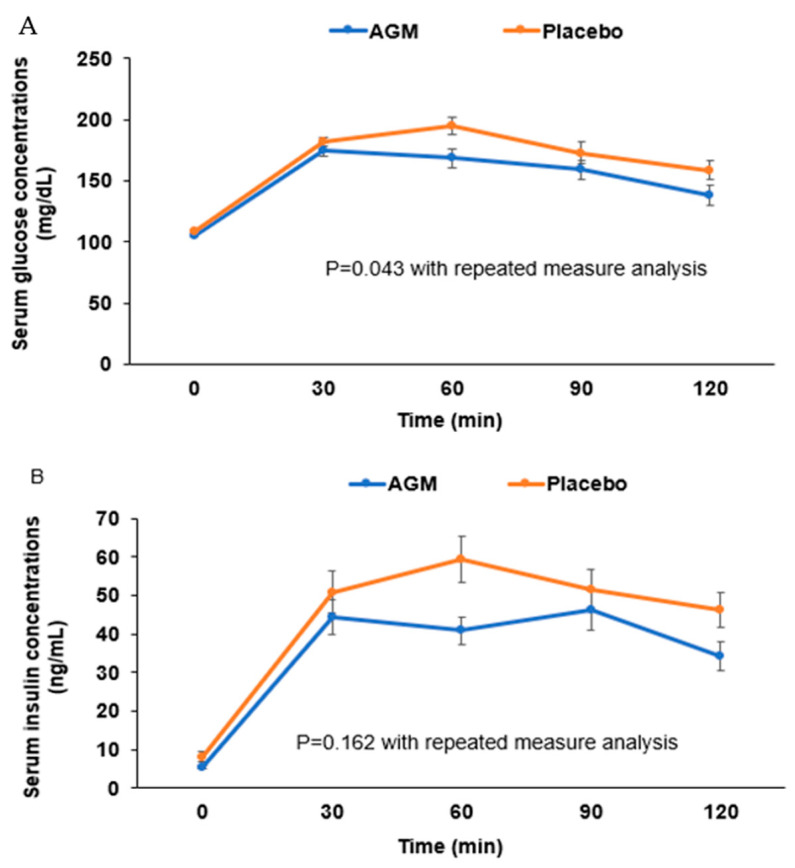
Figure 2.
The changes of serum glucose (A) and insulin (B) concentrations during the oral glucose tolerance test after the 12-week intervention. Dots and error bars indicate means ± standard errors. Statistical significance was analyzed by linear mixed model for repeated measure data differences between groups after adjusting for baseline body weight.

