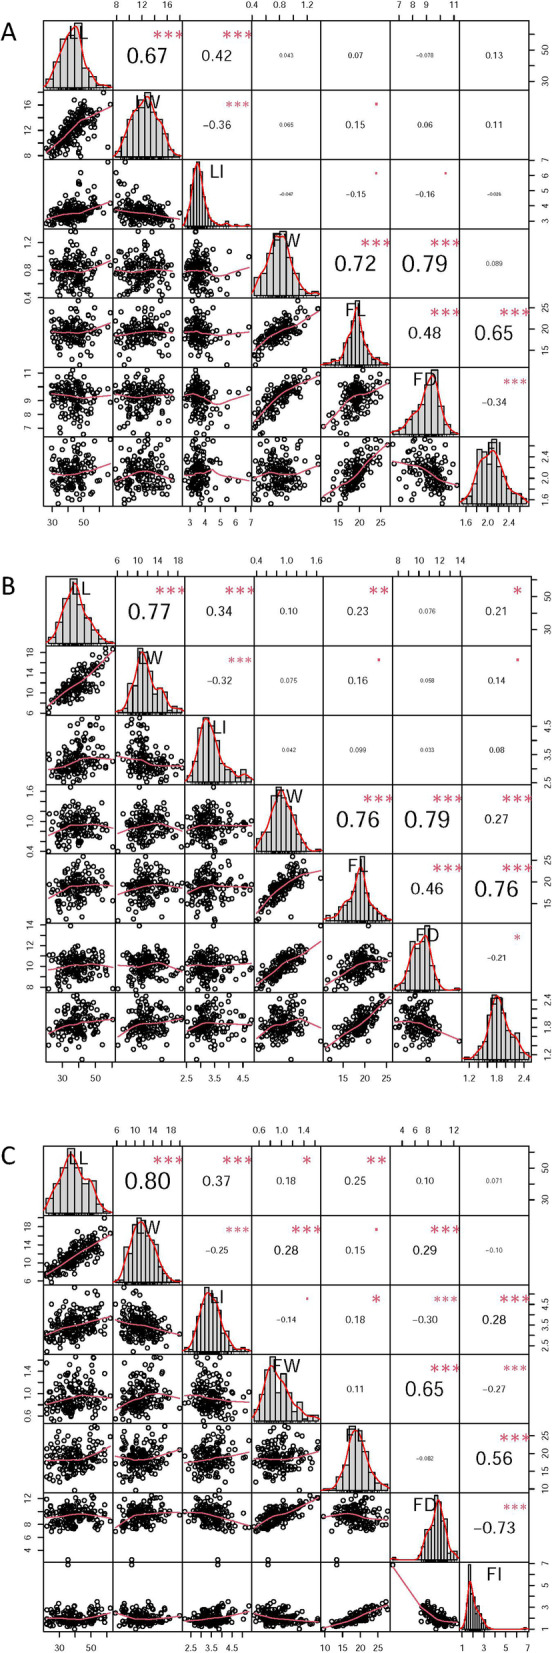
Fig. 2.

The variation and Pearson pairwise correlation analyses of leaf-related and fruit-related traits of the F1 population. (A), (B) and (C) represent the variation and Pearson pairwise correlations in 2016, 2017 and 2018, respectively. The correlations were calculated with Spearman correlation coefficients, and the P values are indicated as follows: *, P < 0.05; **, P < 0.01; ***, P < 0.001. The analysis was performed using the R package PerformanceAnalytics. Histograms for LL (leaf length), LW (leaf width), LI (leaf index), FW (fruit weight), FL (fruit length), FD (fruit diameter) and FI (fruit index) are displayed along the diagonal
