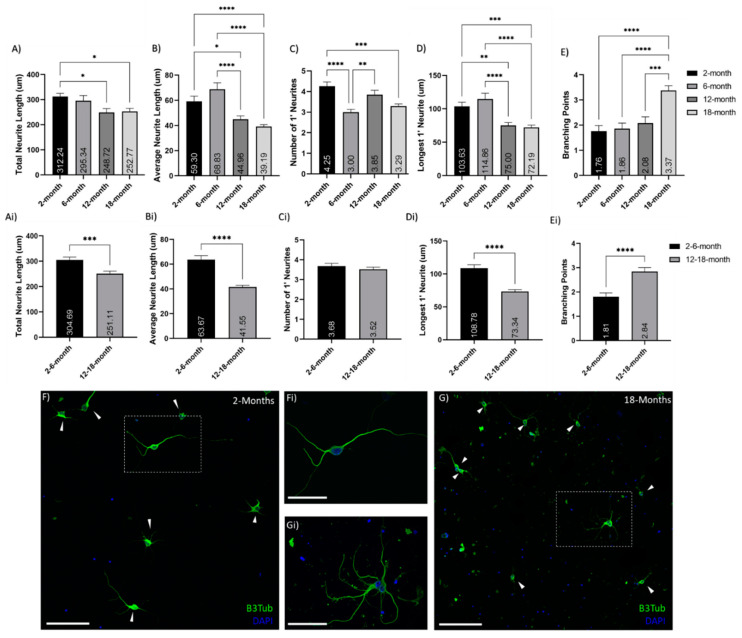
Figure 1.
Reduction of neurite outgrowth with age. Histograms of neurite analysis and feature quantifications comparing between (A–E) 2-, 6-, 12- and 18-month-old neurons, as well as (A–E) grouped young (2- and 6-month-old) and older (12- and 18-month-old) neurons. These show decreased neurite growth and increases branching in older neurons, compared to young: (A,Ai) show age-related decreases in total neurite growth per cell; (B,Bi) show decreases in the average neurite length with age; (C,Ci) show the number of primary (1′) neurites per cell; (D,Di) show a decline in primary neurite length with age; (E,Ei) indicate an increase in neurite branching with age. This pattern is illustrated in the representative 20× confocol images of (F) 2-month and (G) 18-month cortical neuron cultures after 7 days in vitro; stained with βIII-Tubulin (Green) and DAPI (Blue); inset (Fi,Gi) show 60× magnification of neurons. These images also show the increased debris and less healthy look of the old neurons after 7 DIV. * (p < 0.05), ** (p < 0.005), *** (p < 0.0005), **** (p < 0.0001). N = 50–75 cells/age. Graphs show mean and SEM. Arrows indicate individual neurons. Scale bars are 100 μm for F and G; 50 μm for Fi and Gi.

