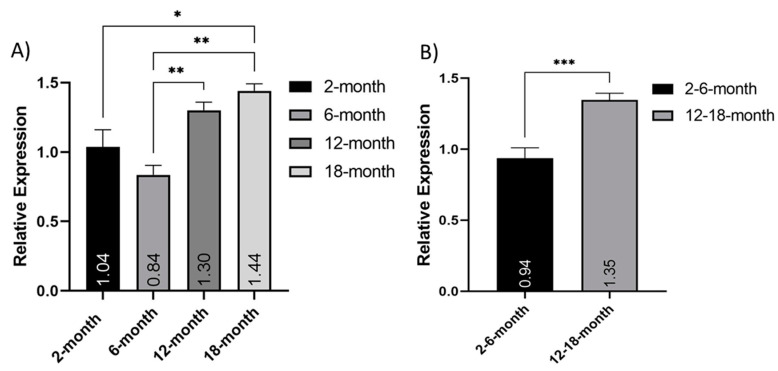
Figure 2.
Increase in Mitochondrial DNA expression with age. Relative expression of the mitochondrial 16s ribosomal DNA sequence normalized to the nuclear-encoded 18 s ribosomal DNA sequence: (A) comparing 2-, 6-, 12- and 18-month-old isolated neuron populations (N = 2); (B) comparing grouped young (2- and 6-months old) and older (12- and 18-months old) (N = 4). * (p < 0.05), ** (p < 0.005), *** (p < 0.0005). Graphs show mean and SEM.

