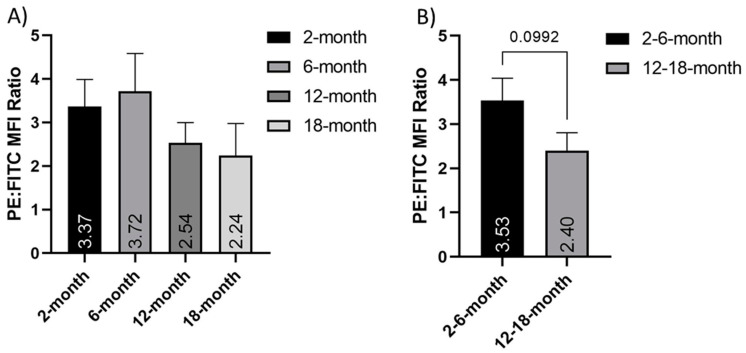
Figure 6.
Depolarization of the mitochondrial membrane in older neurons. Histograms of the PE:FITC mean fluorescent intensity (MFI) ratio of JC-1 stained cortical neurons normalized to FCCP treated controls, both in (A) 2-, 6-, 12- and 18-month-old isolated neuron populations and (B) grouped young (2- and 6-months old) and older (12- and 18-months old) neurons. These show a nonsignificant age-dependent decrease in mitochondrial membrane potential. N = 8. Graphs show mean and SEM.

