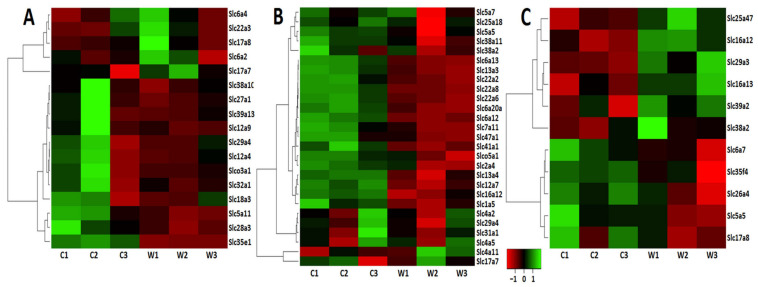
Figure 2.
Heatmap visualization. The heatmap analysis based on expression profiles of the Slc* DEGs in the brain regions of the winners (W1, W2, W3) and control male mice (C1, C2, C3) in the VTA (A), NAcc (B), and PFC (C). The genes were clustered using linkage hierarchical clustering by Euclidean distance. The gene expression levels are shown with red for low, black for middle, and green for high expression levels.

