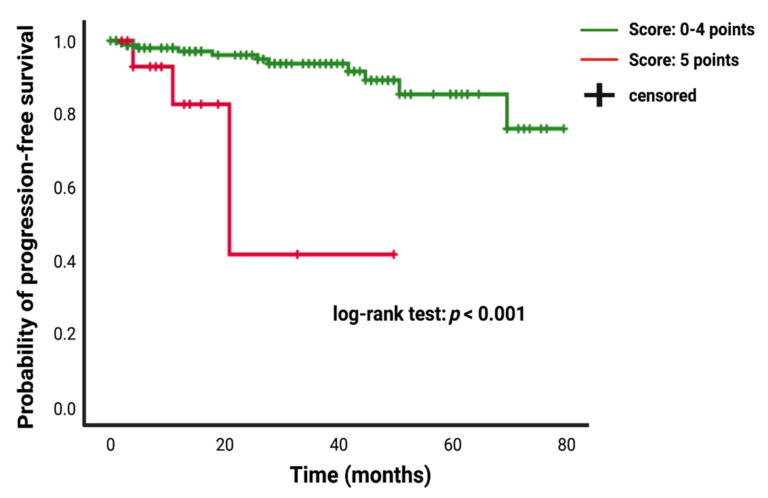
Figure 5.
Kaplan–Meier analysis of tumor progression probability stratified by “score: 0–4 points” (green line) and “score: 5 points” (red line). Vertical dashes indicate censored data (here: progression-free at last follow-up) within the progression-free survival curves. The time axis is right-censored at 80 months. p < 0.001 (log-rank test).

