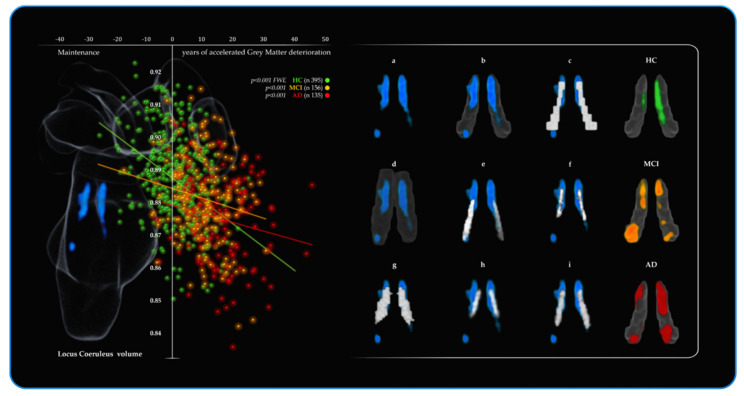
Figure 4.
Results from the VBM multivariate linear regression analyses performed in CAT12 for the three groups (HC, MCI, AD). The results are covaried for total intracranial volume (TIV), age and education. The scatterplot displays the relationship between Locus Coeruleus (LC) volume (y axis) and BrainPAD (x axis) for the three groups: green (HC, n.395), orange (MCI, n.156), red (AD, n.135). On the x axis (BrainPAD) are the years of discrepancy between chronological age and the actual biological brain age based on the degree of Grey Matter deterioration. Negative values of BrainPAD mirror a better GM brain maintenance corresponding to a “younger brain age” than the chronological age. Positive values of BrainPAD mirror the accelerated brain’s GM deterioration, namely, positive values correspond to a worse biological maintenance, and to an older brain than the chronological age. The systematic decline of the LC volume across the three groups is related to a progressive accelerated GM deterioration. Indeed, HC values are shifted more towards the upper-left portion of the graph (negative values of BrainPAD and greater LC volume), whereas MCI and AD are more shifted towards the lower-right portion of the graph (positive values of BrainPAD and lower LC volume). On the left portion of the figure, blue shows the average LC results for the three groups (n = 686, p < 0.00001 FWE) on a 3D fronto-lateral view of the Brainstem and the Diencephalon. On the right portion of the figure are the 3D reconstructions (displayed in the MNI152 space) of the results in comparison with previously published LC atlases and masks. (a) average LC result; (b) average LC result is shown in the LC “omni-comprehensive” mask; (c) Keren et al. (2009) [102,107]; (d) Tona et al. (2017) [108]; (e) Betts et al. (2017) [109]; (f) Dahl et al. (2019) [33]; (g) Liu et al. (2019) [110]; (h) Rong Ye et al. (2020) [111]; (i) LC meta-mask by Dahl et al. (2021) [70]. The last column on the right shows the regions of the LC mask negatively related to BrainPAD values for the three groups considered separately: HC n = 395 (p < 0.001 FWE), MCI n = 156 (p < 0.001) and AD n = 135 (p < 0.001).

