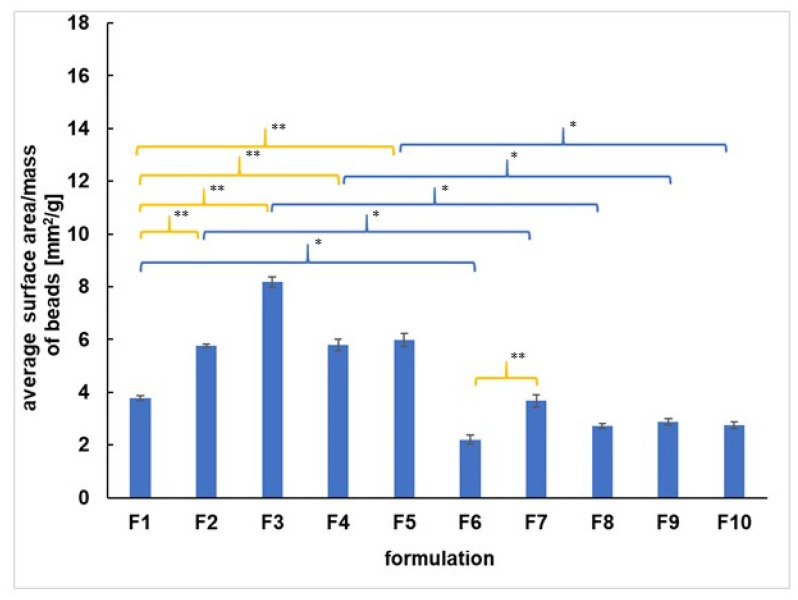
Figure 2.
The average surface area per mass of coated beads F1–F10. Significant differences between the average values of surface area per mass of F1–F10 were marked, p < 0.05; * indicates the differences connected with 5-ASA incorporation, ** shows the discrepancies resulting from incorporation of the synthetic polymer.

