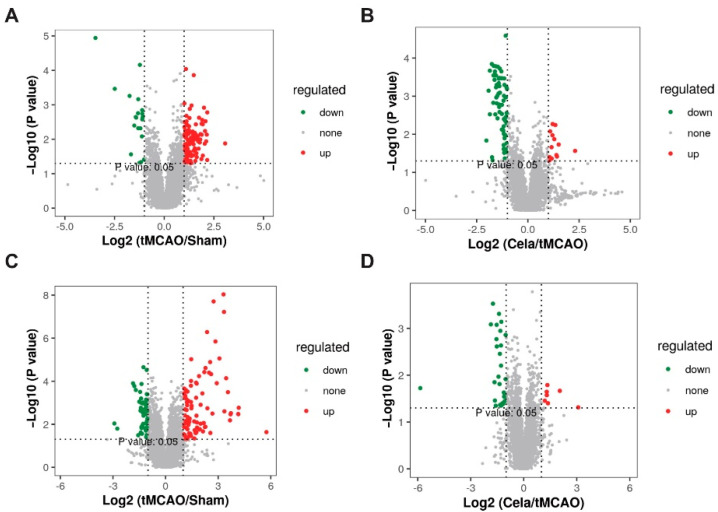
Figure 3.
The volcano map showed the differential lipids expression level among the Sham mice, tMCAO mice and Cela-treated tMCAO mice. The red color indicates the upregulated lipids, while green color represents the downregulated lipids. (A) plasma_tMCAO/Sham, (B) plasma_Cela/tMCAO, (C) brain_tMCAO/Sham and (D) brain_ Cela/tMCAO groups.

