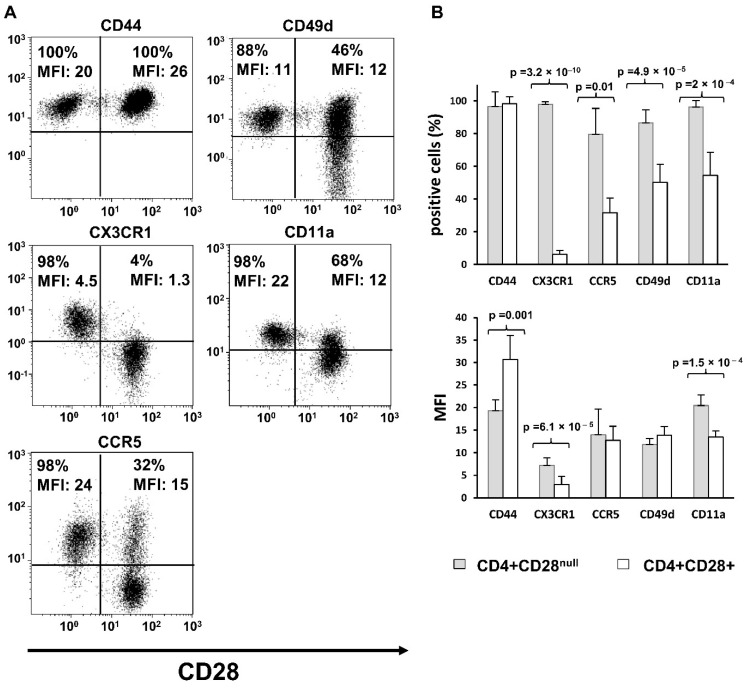
Figure 1.
Basal expression of adhesion molecules and chemokine receptors. Results are representative for peripheral blood of seven RA patients. Expression levels of CD44, CX3CR1, CCR5, CD49d, and CD11a were analysed in both CD4+CD28+ and CD4+CD28null T cells by flow cytometry. (A) Dot-plots show a representative experiment; CD28 stain is represented on the X axis. The percentage of positive cells and MFI for each molecule is displayed in the figure. (B) Histograms represent the percentage of positive cells and MFI (mean ± SD) in CD28+ and CD28null cells. Paired T tests were used to compare differences; significant differences are indicated on the panel.

